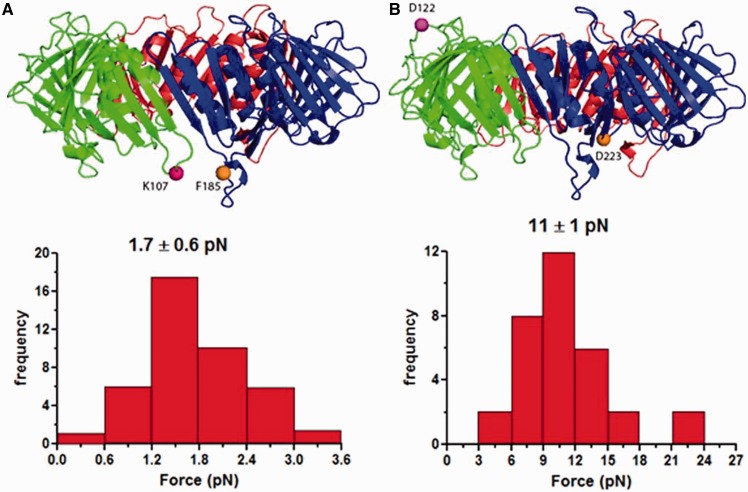
Figure 3.
Histograms of PCNA interface rupture force. Multiple PCNA pulling experiments were performed at different sites; the rupture forces and their corresponding frequencies were plotted in the histogram. (A) PCNA pulled at residues K107 and F185. The interface was ruptured at 1.7 ± 0.6 pN. (B) PCNA pulled at residues D122 and D223. The interface was ruptured at 11 ± 1 pN.

