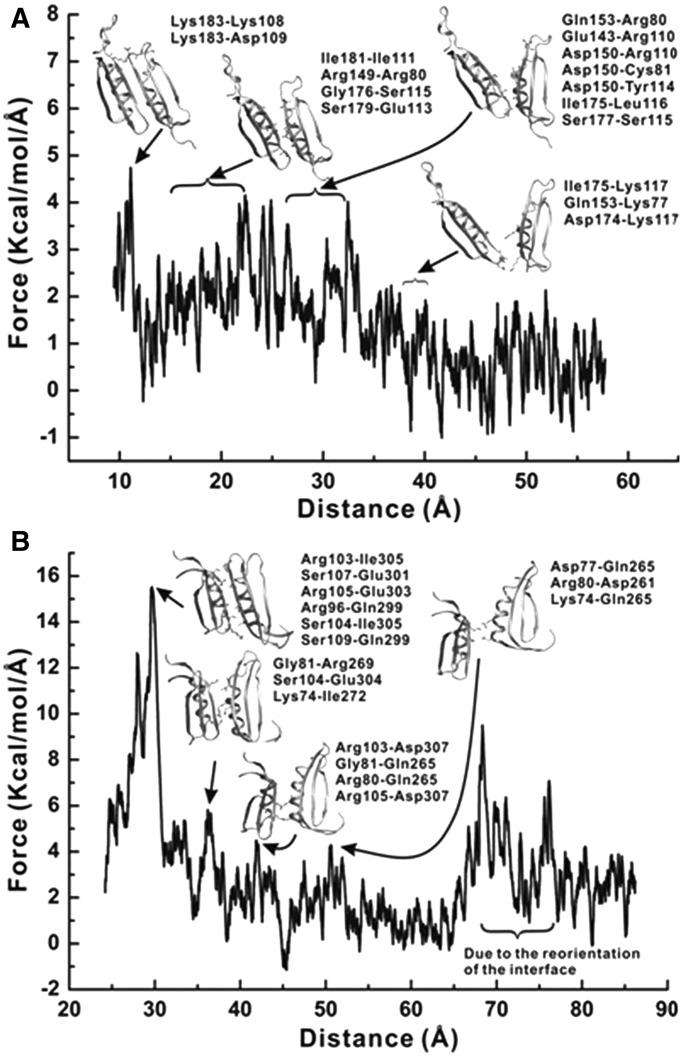
Figure 6.
Interface disruption mechanism as determined from the SMD force-extension profiles for (A) yeast PCNA and (B) E. coli β-clamp. The force-extension profile is smoothed by adjacent averaging for a 100-frame window. Representative snapshots of the subunit interfaces at different stages of separation are shown. Arrows indicate the correspondence to distinct peaks in the force-extension profiles.

