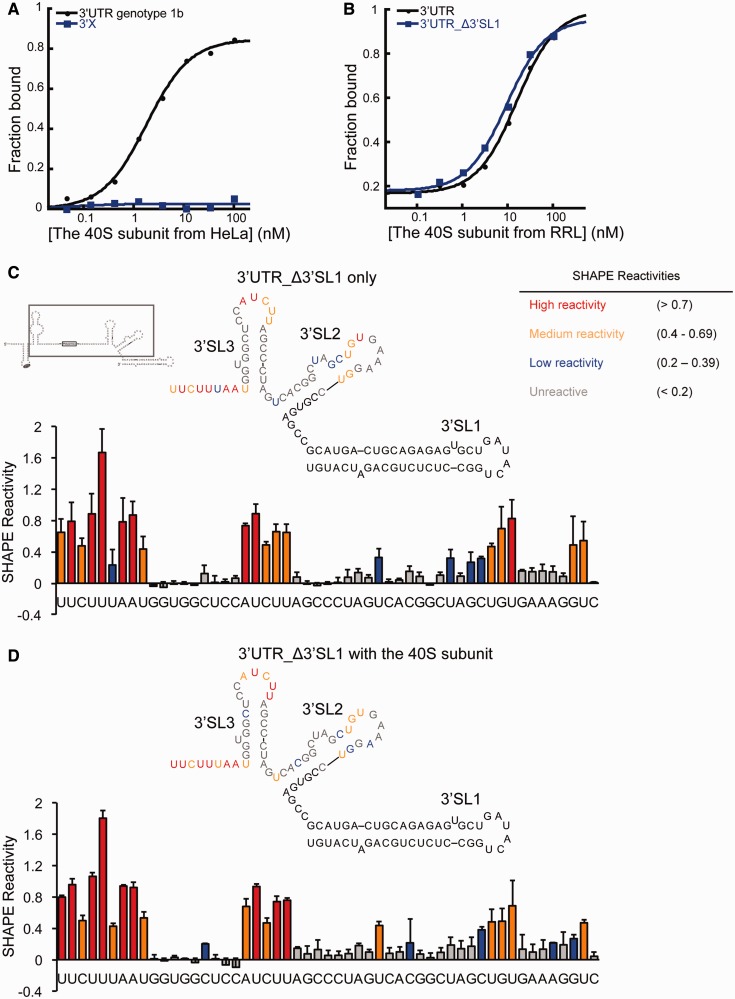
Figure 3.
The contribution of the 3′X region in the HCV 3′UTR-40S interaction (A). Binding isotherms showing the 3′X region alone cannot interact with the 40S subunit. (B). Binding isotherms showing full-length 3′UTR and 3′UTR_Δ3′SL1 interact with the 40S subunit similarly. (C and D). SHAPE analysis of the 3′UTR either alone or in complex with the 40S subunit. The gray box shows the construct used in these experiments. In red are highly reactive nucleotides, in orange are medium reactive nucleotides, in blue are nucleotides with low reactivity, and in gray are unreactive nucleotides. Nucleotides either with no SHAPE data or not included in the construct are shown in black.

