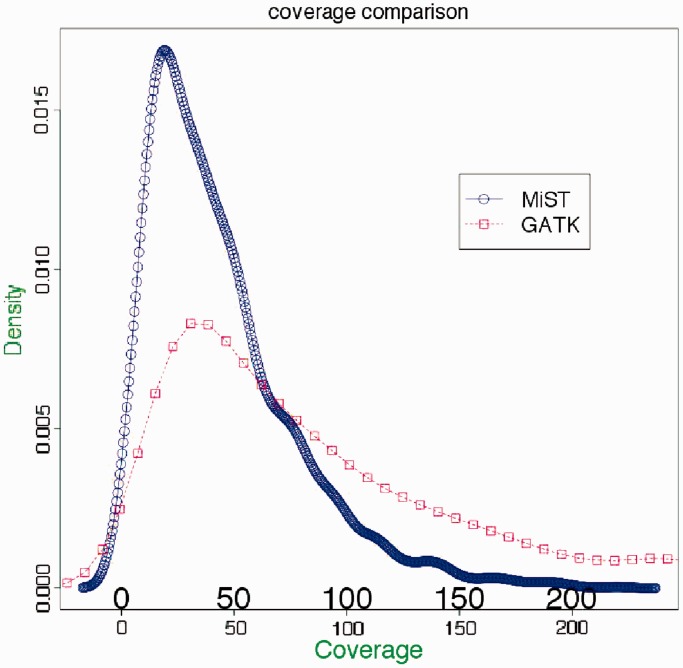
Figure 7.
A comparison of coverage between the MiST and GATK pipelines. The graph shows density distributions of coverage over variants that have been called by both platforms. The total area under each curve is 1. As seen from the graph, MiST has, on average, lower coverage per variant compared with GATK, due to more stringent removal of artifacts arising from clonal reads as well as reads that map to multiple locations.

