Figure 2.
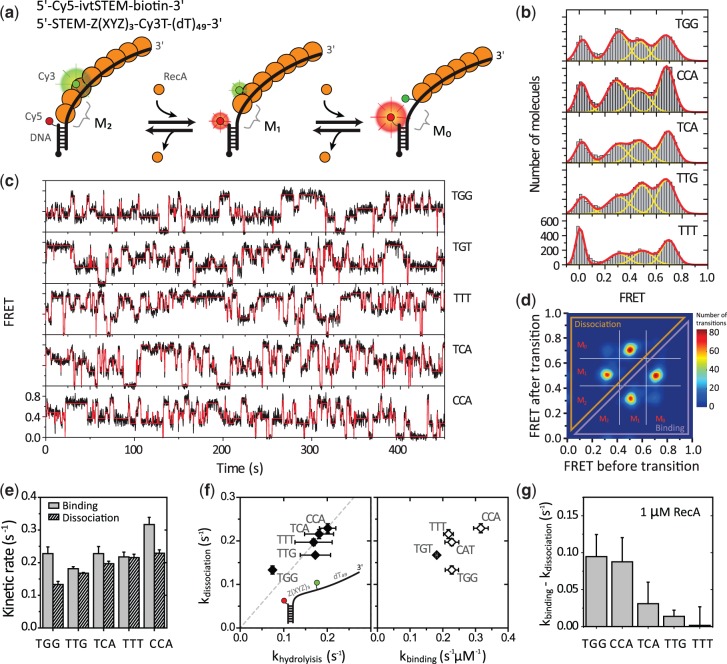
Sequence-dependent filament dynamics at the 5′-disassembly end. (a) Top: DNA sequences and dye-labeling positions. Bottom: Illustrated is a schematic of RecA monomer binding and dissociation at the 5′ end of a filament. M2: two monomers between a pair of dyes. M1: one monomer. M0: no monomer. (b) smFRET histograms with five different DNA sequences. The three distinct FRET populations were fitted with Gaussian peaks (yellow lines for individual peaks and a red line for the sum of the peaks) with an additional peak at zero from donor-only molecules. (c) Typical FRET time traces (black lines) obtained with different sequence combinations. The transition points of monomer binding and dissociation were determined with HMM (red lines). (d) An example TDP of 7560 transitions from 94 molecules with TTT. (e) The monomer binding and dissociation rates obtained with the HMM. (f) A correlation plot of the dissociation rate versus the ATPase rate (left) and the dissociation rate versus the binding rate for each sequence (right). The broken line is the linear fit of the data. Error bars are standard deviations from three data sets. (g) The apparent shrinkage rates of a filament at the 5′ end. It was obtained by subtracting the dissociation rate from the binding rate in (e) (kshrinkage = kon × [RecA] − koff).

