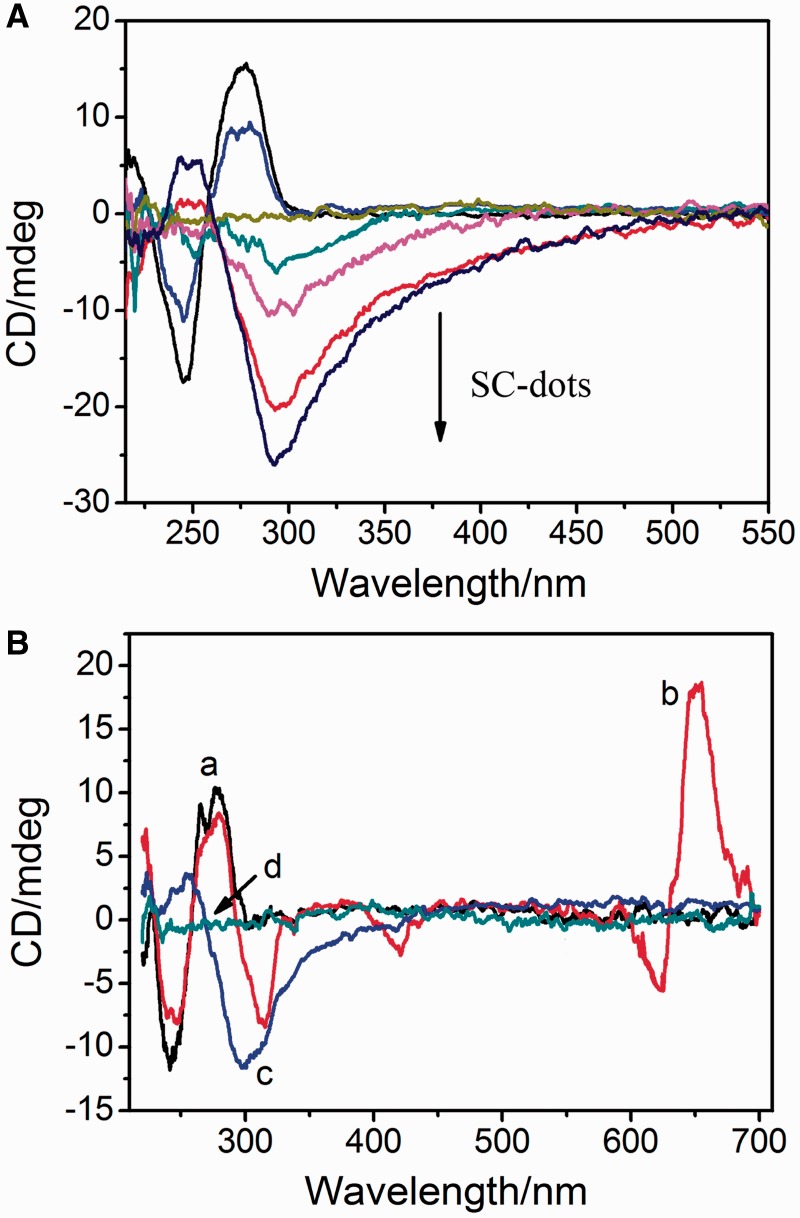
Figure 4.
(A) CD spectra of ct-DNA titrated with different SC-dots: 0, 1, 2, 3, 5, 8 µg/ml. The straight lint in middle is CD spectrum of 5 µg/ml SC-dots alone. (B) CD spectra of ct-DNA alone (a, black); ct-DNA with MG molecule (b, red); and addition of SC-dots to the above solution (c, blue); SC-dots alone (d, green), ct-DNA: 30 µg/ml; MB: 25 µM; SC-dots: 5 µg/ml.

