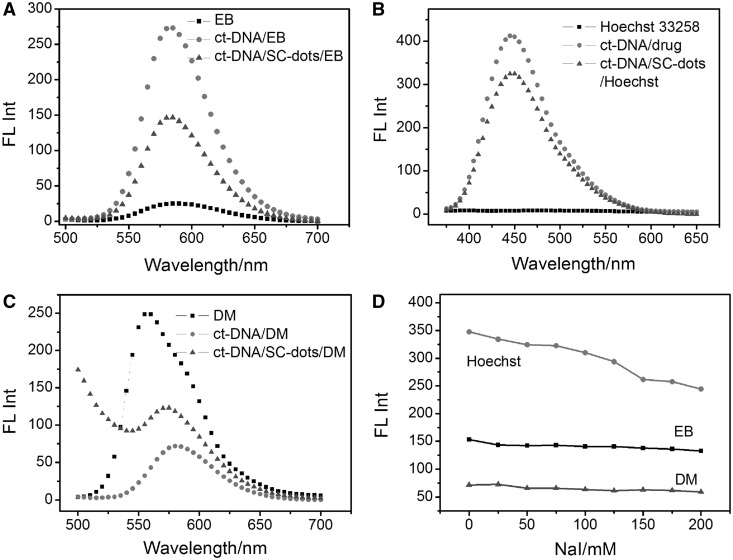
Figure 5.
Fluorescence emission spectra of (A) 1 µM EB (Excitation wavelength: 480 nm); (B) 1 µM Hoechst 33258 (Excitation wavelength: 355 nm); (C) 1 µM DM (Excitation wavelength: 480 nm): 1 µM fluorophore (EB, Hoechst 33258, DM) alone (squares), 30 µg ml−1 ct-DNA+ 1 µM fluorophore (dots), 30 µg ml−1 ct-DNA+5 µg ml−1 SC-dots+ 1 µM fluorophore (uptriangles). (D) Plot of fluorescence intensity of fluorephore-DNA–SC-dots versus NaI concentrations from 0 to 200 mM. ct-DNA: 30 µg ml−1; SC-dots: 5 µg ml−1; 1 µM different fluorephore drugs.

