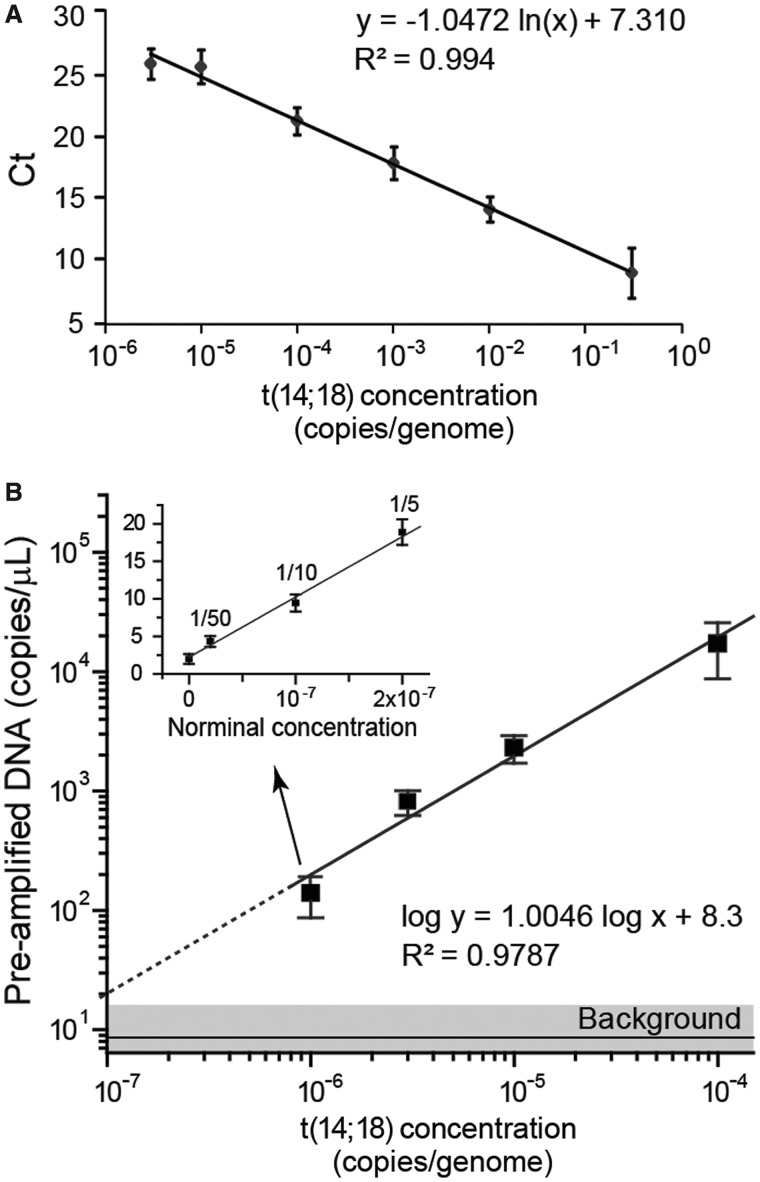
Figure 2.
Characterization of hemi-nested real-time PCR (qPCR) and microfluidic dPCR assays for quantitation of the t(14;18) translocation. (A) The hemi-nested qPCR analysis of t(14;18) copies spiked in negative human genomic DNA shows a linear standard curve of the threshold cycle (Ct) as a function of the t(14;18) concentration [copies of t(14;18)/total genomic copies] with a dynamic range spanning five orders of magnitude and a limit of detection near 10−6 copies t(14;18)/genome. The error bars represent standard deviation (n = 3). (B) The hemi-nested microfluidic dPCR assay quantitatively measures t(14;18) concentration with a limit of detection on the order of 10−7. The error bars represent standard deviation (n ≥ 3). The inset demonstrates quantitative measurements of further dilutions (down to 1/50) of the pre-amplified product from the lowest concentration standard [∼10−6 copies t(14;18)/genome]. The error bars indicate standard error.

