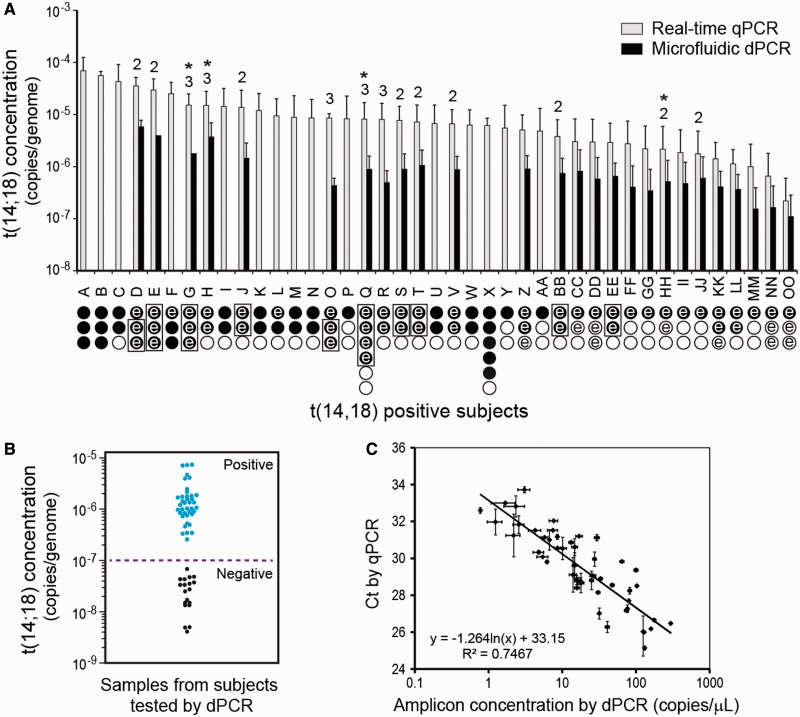
Figure 3.
Concentration of t(14;18) in positive study subjects. We detected t(14;18) in the clot gDNA of 41/93 healthy test subjects (∼44% prevalence). (A) Subject IDs are given on the abscissa, and the bar-height indicates the average concentration of t(14;18) in a given subject as determined by the hemi-nested PCR techniques. The error bars indicate the standard deviation in the measurement. Below the subject ID on the abscissa, the number of 3 µg of preamp reactions conducted on the subject’s gDNA is indicated by the total number of circles. Filled circles indicate that a preamp reaction was positive by standard qPCR, whereas open circles indicate that the preamp reaction was found negative by standard qPCR. If an assay circle is marked with the letter ‘e’, then that preamp reaction was also tested using microfluidic PCR, and in these cases, the quantitative result from dPCR is also given. A box grouping preamp reactions indicates that these reactions were pooled before dPCR analysis. The data from these parallel measurements (when positive) contributed data to part c of this figure. For all positive subjects, at least one clonal form of t(14;18) was confirmed by sequence analysis; in some subjects, multiple clonal forms of t(14;18) were defined. If multiple clonal forms were found in a subject, the total number of defined clones is indicated above the error bars. An asterisk indicates that one clonal form for that subject went undetected in qPCR and was then discovered and/or defined in dPCR. (B) The dot scattered plot of the nested dPCR measurements of the preamp reactions showing the distinct populations for the t(14;18) positive and negative subjects. The dashed line indicates the detection limit of 10−7 determined in Figure 2. (C) The two methods represented in Figure 1c and d correlate well for quantitating t(14;18) both in cell line-derived DNA standards and in clot DNA samples from chemically exposed workers. The horizontal error bars are standard error and the vertical error bars are standard deviation (n = 2).

