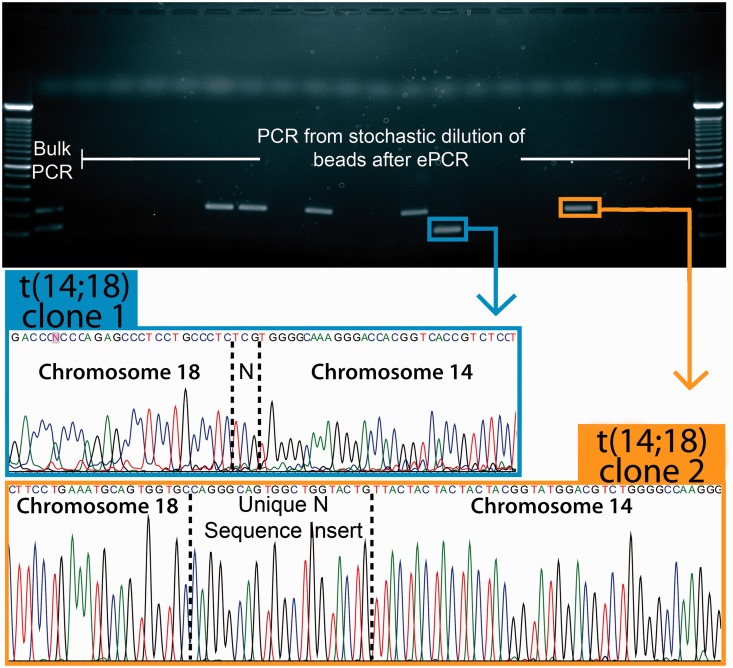
Figure 4.
Definition and quantitation of clonal forms within subject samples. Representative results for the gel and sequence analysis of a single subject (‘D’) who was found to be positive for two unique clonal forms of t(14;18). The gel bands were excised for sequencing reactions, and sequence analysis defined the clonal forms of t(14;18) present in the sample. In bulk assays, both clonal forms amplify together, and it is not possible to estimate their relative concentration. However, in digital microfluidic dPCR, the different clonal forms are discretely encapsulated in nanoliter-scale reaction droplets along with primer-functionalized beads. The resulting digital reactions load individual beads with amplicon that represents only a single form of the translocation. By simply counting the number of ‘large’ and ‘small’ bands or sequence reads, the relative ratio of clonal forms within a sample can be estimated. In this gel section, the ratio of clone 1:clone 2 is 1:5, but gel analysis of more reactions from this subject estimates the ratio as ∼18:37 (see Supplementary Figure S3b).

