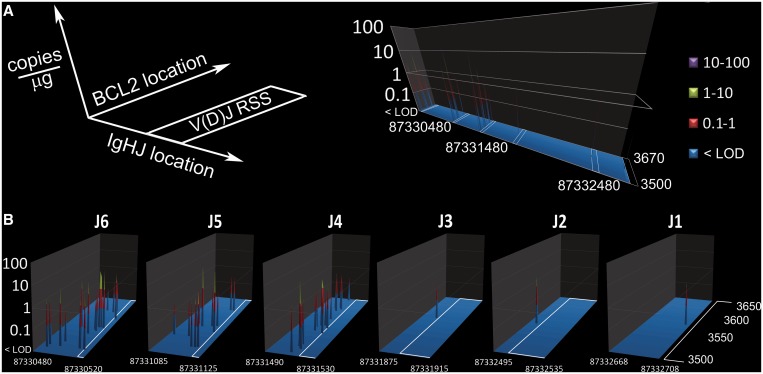
Figure 5.
Quantitative genetic profile of t(14;18) breakpoints in positive study subjects. The clonal form of t(14;18) defined in this study are quantitatively mapped to their breakpoint coordinates on Chromosomes 14 (position on NT_026437.11) and Chromosomes 18 (position on NM_000633.2). Most positive subjects (27/41) were positive for a single, unique form of t(14;18); however, 9/41 positive subjects were confirmed to be positive for two unique clonal forms, and 5/41 were confirmed to be positive for three unique clonal forms (also see Figure 3 and Supplementary Table S1). (A) The amount and coordinates of these 60 clonal forms of t(14;18) are mapped to a global genetic plot. The white boxes on the plot indicate the locations of the IgHJ RSSs that direct V(D)J recombination. (B) A magnified view of each t(14;18) cluster is shown; all clusters were found on the heptamer side of an IgHJ RSS. For details of sequence analysis results on these clonal forms, see Supplementary Table 1. For details regarding the mapping of the IgHJ RSSs to NT_026437.11, see Supplementary Figure S6.

