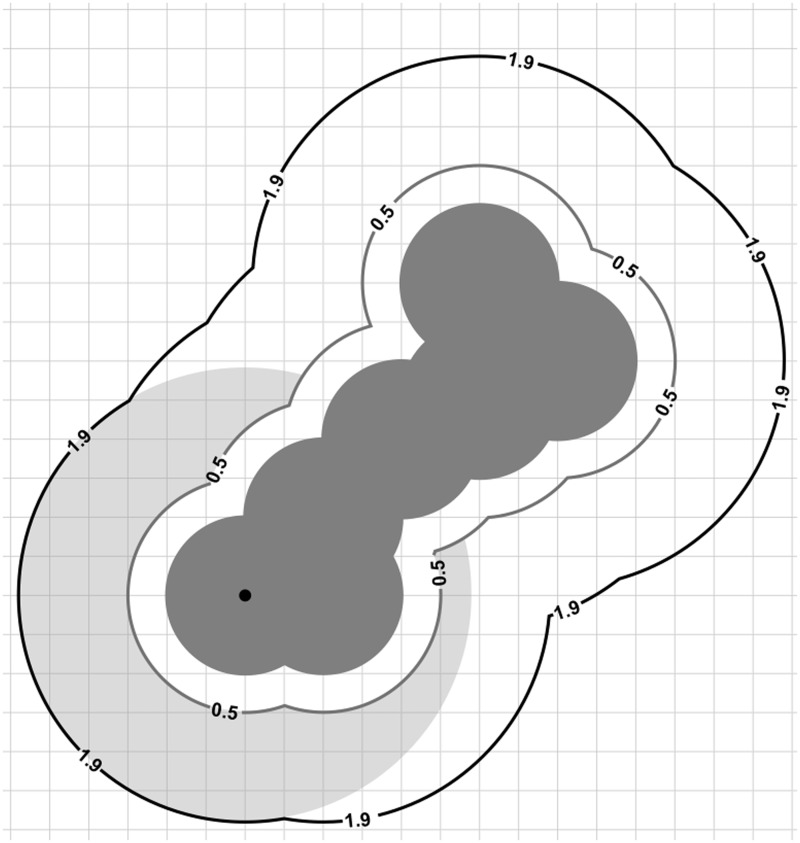
Figure 1.
The figure illustrates calculation of the atom-level electrostatic feature within a shell offset 0.5 Å from the van der Waals surface. The grid on which the electrostatic potential is calculated is shown relative to the molecule, shown in dark gray, and the atom at which the feature is calculated is marked using a black dot. Electrostatic potential values at grid points within the light gray annular region are those averaged to generate the feature for this atom. Grid points inside the 0.5 Å offset surface are excluded from the calculation. The light gray annular region is 1.4 Å in width, regardless of the offset used to define the shell.

