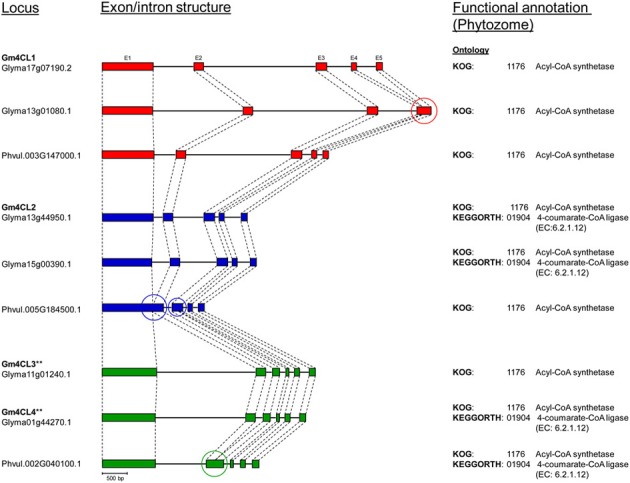
Figure 5.

Comparison of 4CL genes exon/intron structure between soybean (Williams 82, Phytozome) and common bean (G19833, Phytozome). Exons (E) are represented as filled boxes and introns are shown as lines between the exons. **Exon/intron structure (exon 1 and intron 1) of Glyma01g44270 and Glyma11g01240 loci was corrected based on the Phytozome/GenBank/cDNA sequence alignments. Circles indicate loss/gain of exon.
