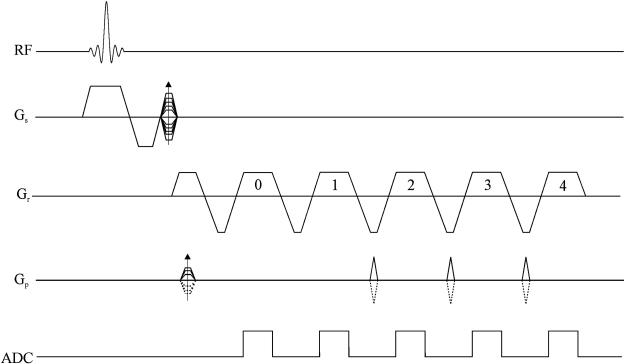
Fig. 1.
Sketch of the proposed sequence diagram with a turbo speed factor of 4. Only the even echoes in the echo train are sampled (this represents what is often referred to as a flyback method). The top half of k-space is covered with the phase-encoding table and phase-encoding blips as shown (continuous lines), while the lower half of k-space is covered by inverting the polarity of the phase-encoding table and phase-encoding blips (dashed lines). Notice that data acquired at the 0th echo are for calibration purposes; hence, there is no phase-encoding blip between echo 0 and echo 1. No ETS is applied to the acquisition.

