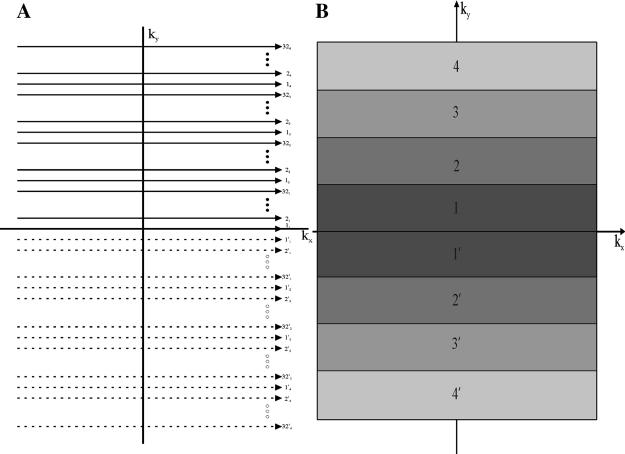
Fig. 2.
(A) Sketch of the 2D k-space trajectory with a turbo speed factor of 4. The top half of k-space (continuous lines) is covered by 32-shot interleaved SEPI (assuming 256 k-space lines in total). Each k-space line is labeled as kj, with k as the shot number and j as the order on each interleave. Notice the center-out k-space trajectory. Thirty-two other shots are used to cover the lower half of k-space (dashed lines), with each line labeled as . (B) Sketch of the 2D k-space coverage by region. Each shaded region represents that part of k-space acquired at the same echo time. The number in each shaded region corresponds to the echo number in the echo train (Fig. 1). Each region contains 32 phase-encoding lines.

