Figure 2.
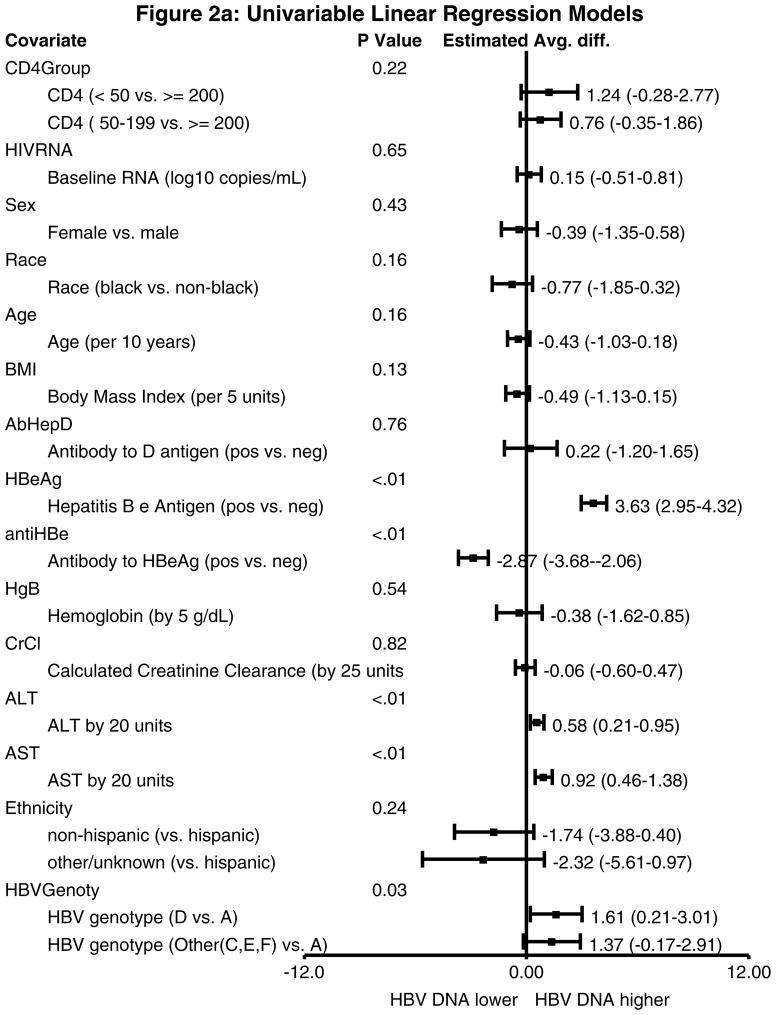
Figure 2a. Univariable linear regression models with log HBV DNA as the outcome. HBeAg positive status was associated with a 3.63 log IU/ml higher HBV DNA, anti-HBe positive status was associated with a 2.87 log IU/ml lower HBV DNA, both ALT and AST were associated with higher HBV DNA levels, and non-A genotype HBV was associated with higher HBV DNA levels.
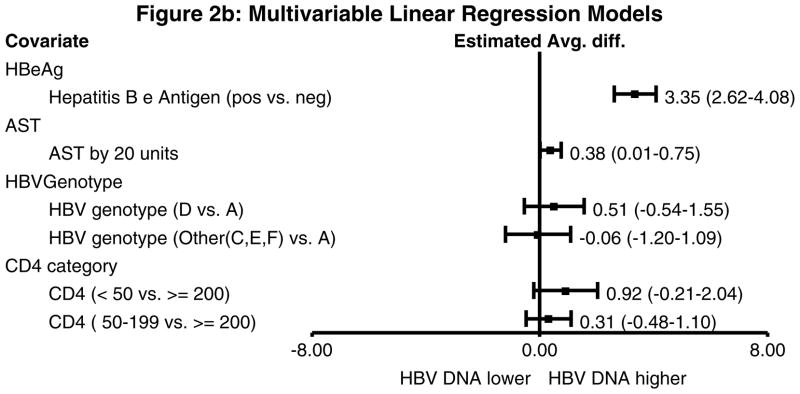
Figure 2b. Multivariable linear regression models with log HBV DNA as the outcome. The associated variables from the univariable models were included in this model and CD4 count was forced into the model. Anti-HBe was not included since it is collinear with HBeAg status. HBeAg-positive status was associated with a significantly higher HBV DNA level (3.35 log IU/ml higher compared to HBeAg-negative subjects). AST was also associated with higher HBV DNA level.


