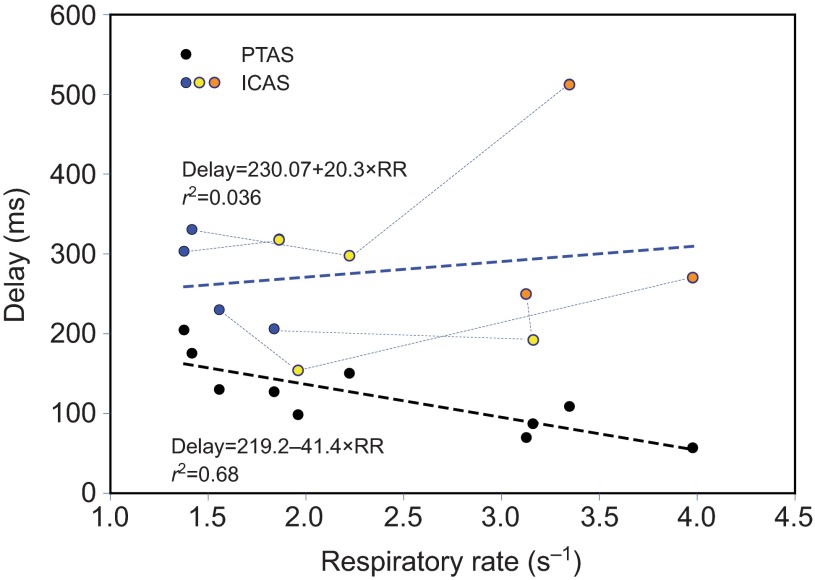
Fig. 6.
The delay between the arrival of helium in the trachea to that in the PTAS and ICAS is variable. Whereas this delay steadily decreases with respiratory rate in the PTAS (dashed black line), it shows a decrease in the ICAS for the elevated respiratory rate of calling (yellow symbols; data for different individuals are connected with dotted lines), but an increase for wing flapping (orange symbols) relative to that of quiet breathing (blue symbols; overall trend is indicated by dashed blue line). This increase results from the fact that during some wing flapping episodes helium did not arrive in the ICAS until the inspiration that followed the one when it passed the tracheal flow probe.

