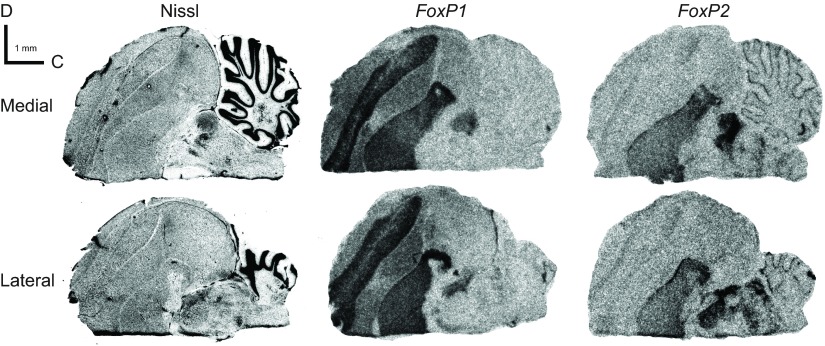
Fig. 4.
Representative brightfield photomicrographs of FoxP1 and FoxP2 mRNA expression patterns in a pair of sagittal sections from adult female Bengalese finch brain. Locations of medial and lateral sections correspond to the level of sagittal plates 6 and 11, respectively, in the zebra finch atlas of Nixdorf-Bergweiler and Bischof (Nixdorf-Bergweiler and Bischof, 2007). The medial plate shows the HVC and LMAN, and the lateral plate shows the HVC and RA in corresponding sections from male birds (Fig. 3).

