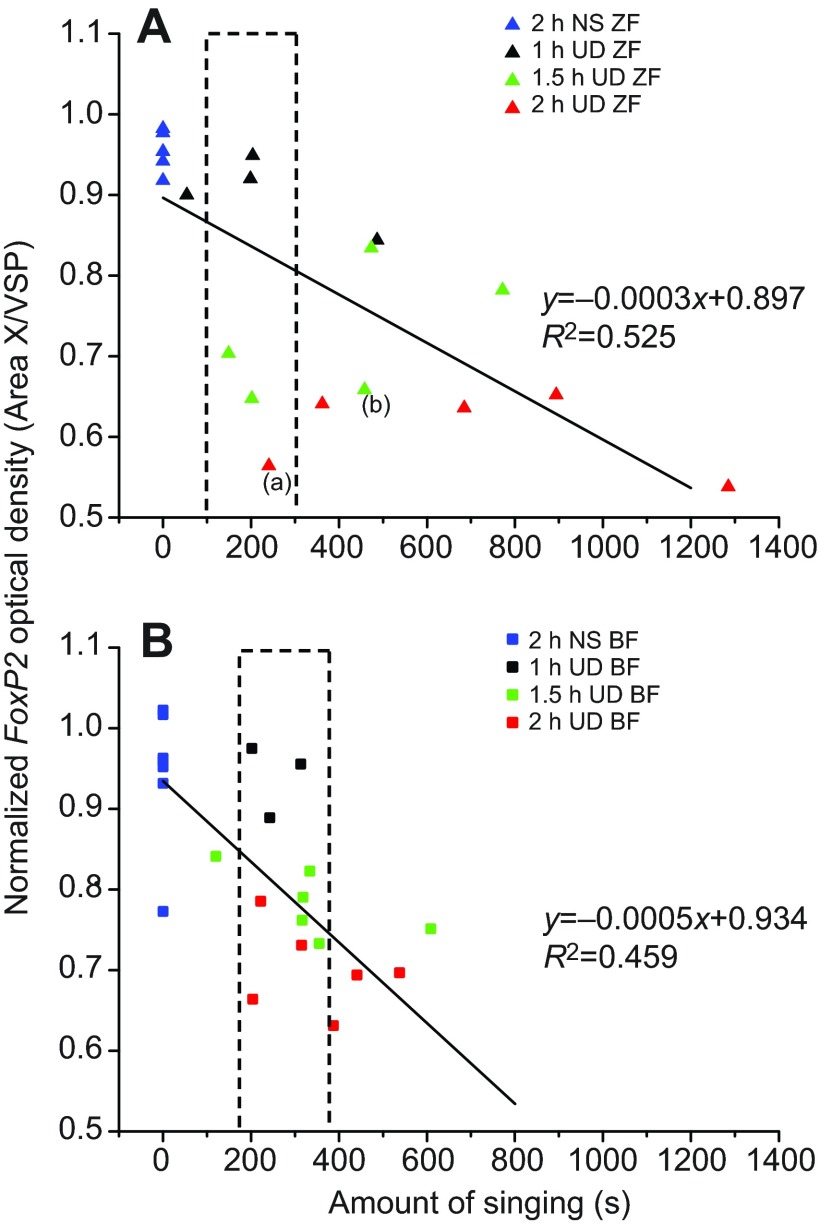
Fig. 7.
Correlation between FoxP2 and amount of singing. (A) In zebra finches, FoxP2 levels decrease as the amount of singing increases (P<0.0002). (B) FoxP2 levels also decrease as the amount of singing increases in Bengalese finches (P<0.0003). There is no significant difference between the two regression lines (P>0.05). The dotted rectangle indicates data from those birds that sang similar amounts of song for each species (see Discussion).

