
Fig. 3.
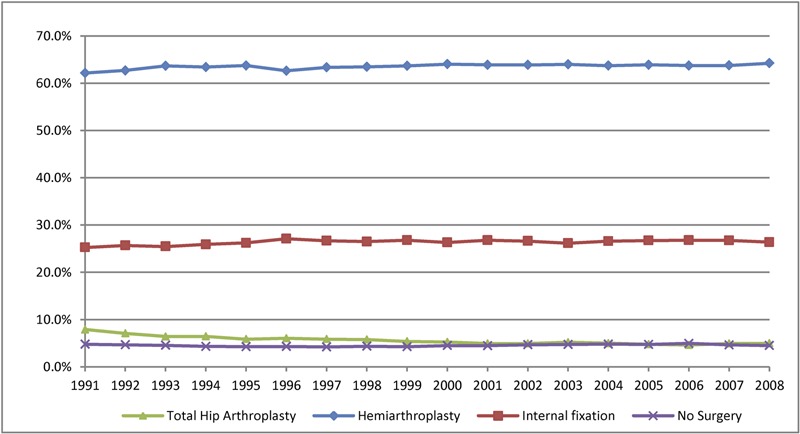
Line graph showing the percentage of hip fractures treated with internal fixation, hemiarthroplasty, total hip arthroplasty, and no surgery in the Medicare population from 1991 to 2008.
Official websites use .gov
A
.gov website belongs to an official
government organization in the United States.
Secure .gov websites use HTTPS
A lock (
) or https:// means you've safely
connected to the .gov website. Share sensitive
information only on official, secure websites.
Line graph showing the percentage of hip fractures treated with internal fixation, hemiarthroplasty, total hip arthroplasty, and no surgery in the Medicare population from 1991 to 2008.