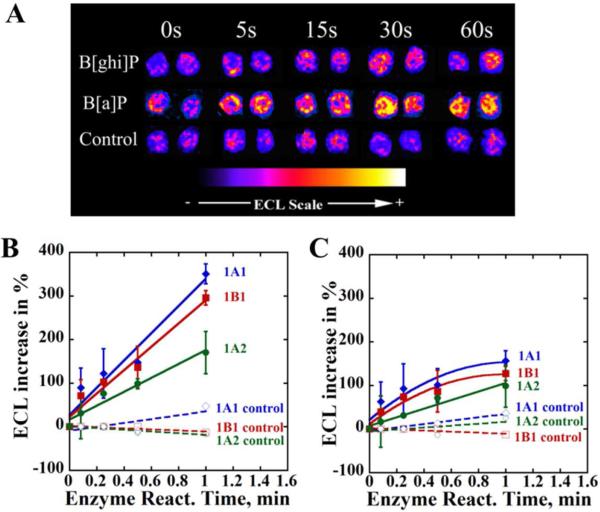
Figure 3.
ECL array results for B[a]P and B[ghi]P (A) example of reconstructed ECL array spots containing DNA/RuPVP/1A1 exposed to either B[a]P and B[ghi]P using an NADPH regeneration system. Control spots were exposed to only B[ghi]P, but no NADPH. (B) and (C) ECL intensities increase (in percentage) versus enzyme reaction time for different enzymes, cyt P450 1A1(blue diamond), cyt P450 1A2 (green dot) and cyt P450 1B1 (red square) incubated with (B) 25 μM B[a]P and NADPH or (C) 50 μM B[ghi]P and NADPH. Controls (dashed lines) featured incubations with only 25 μM B[a]P or 50 μM B[ghi]P, but no NADPH.

