Figure 6.
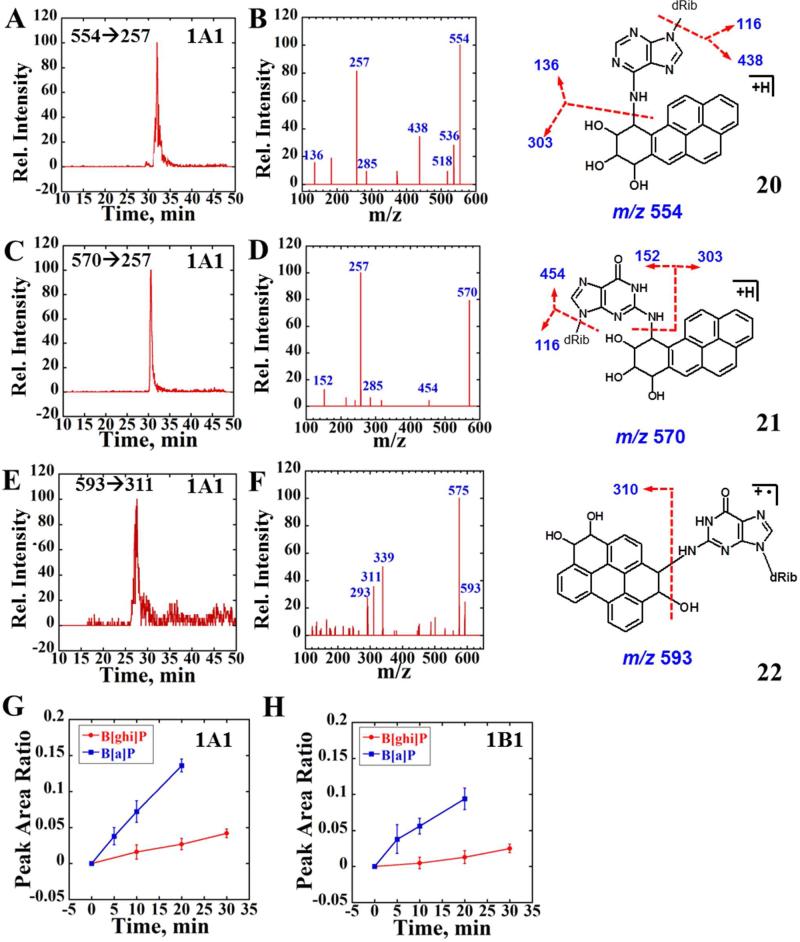
LC-MS/MS analysis of reactions of magnetic biocolloid reactors with B[a]P and B[ghi]P using 1A1 supersomes. (A) and (C) Representative SRM chromatogram with mass transition m/z 554→257 and m/z 570→257 indicating the formation of BPDE-dA and BPDE-dG adducts after 20 min reaction followed by enzyme hydrolysis using supersomes 1A1. (B) and (D) Product ion spectrum of m/z 554 and m/z 560 at CE 30 eV. (E) Representative SRM chromatogram with mass transition m/z 593→311 indicating the formation of B[ghi]P derived dG adduct, possibly formed from B[ghi]P 3,4,11,12-bisoxide after 20 min reaction followed by enzyme hydrolysis using supersomes 1A1. (F) Product ion spectrum of m/z 593 at CE 30 eV. (G) and (H) Blue curves reflect the peak area ratios to the internal standard versus time for the sum of both BPDE-dA and BPDE-dG formation (enzymes are as indicated), red curves represent the ratio for B[ghi]P 3,4,11,12-bisoixdes-dG formation. Possible structures of BPDE-dA (20), BPDE-dG (21) and B[ghi]P 3,4,11,12-biosoxides-dG (22) are also shown with red arrows indicating the major cleave sites.

