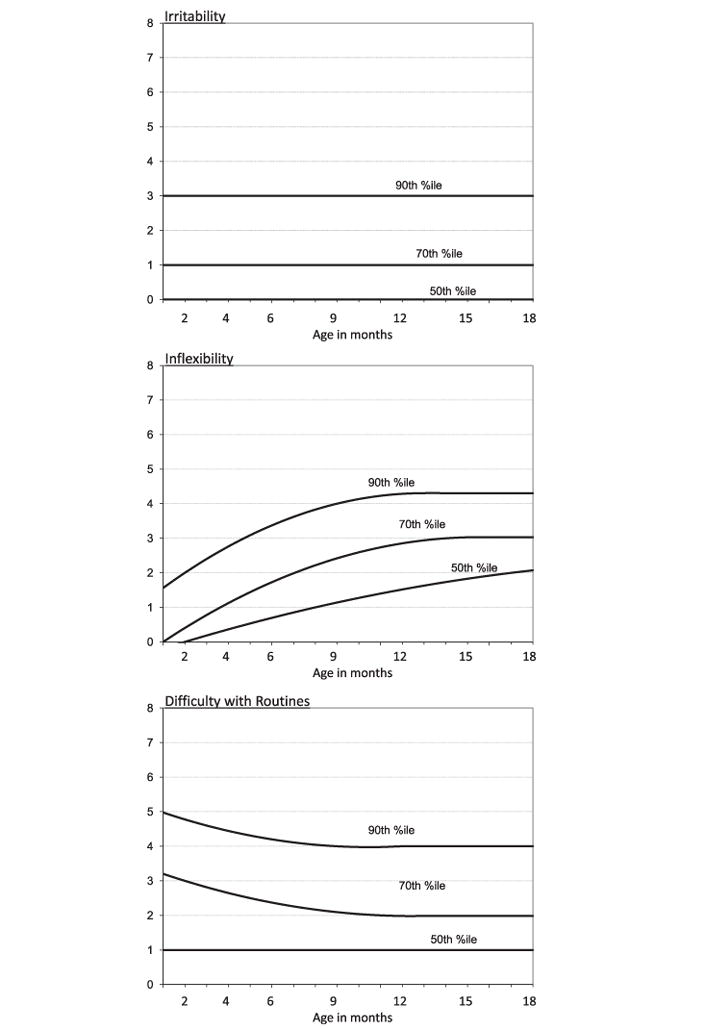
Figure 2.

Normative curves for Baby Pediatric Symptom Checklist (BPSC) scales. Note: Curves are a function of age (months) and age2. Constants, linear, and quadratic coefficients for each curve are as follows: irritability 50th = (0, 0, 0); irritability 70th = (1, 0, 0); irritability 90th = (3, 0, 0); inflexibility 50th = (−0.393, 0.204, −0.004); inflexibility 70th = (−0.432, 0.446, −0.014); inflexibility 90th = (1.086, 0.495, −0.019); routines 50th = (1, 0, 0); routines 70th = (3.426, −0.231, 0.009); and routines 90th = (5.2, −0.233, 0.011).
