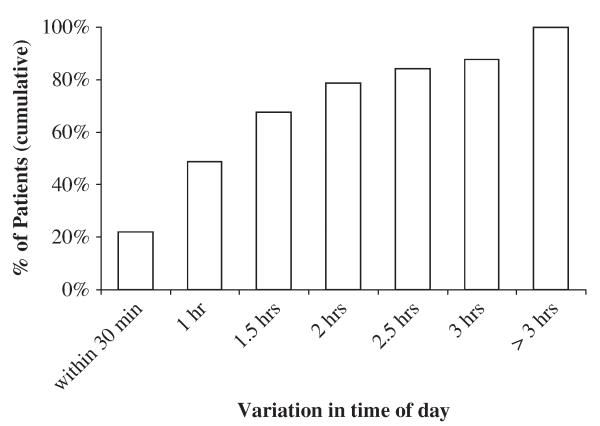
FIGURE 1.
Cumulative distribution of time-of-day difference between intraocular pressure (IOP) measurements on visual field (VF) testing days compared with non-VF testing days. Cumulative percentages shown. Time-of-day difference was calculated as time of IOP measurement on VF testing day minus the average time of IOP measurement on non-VF testing days.

