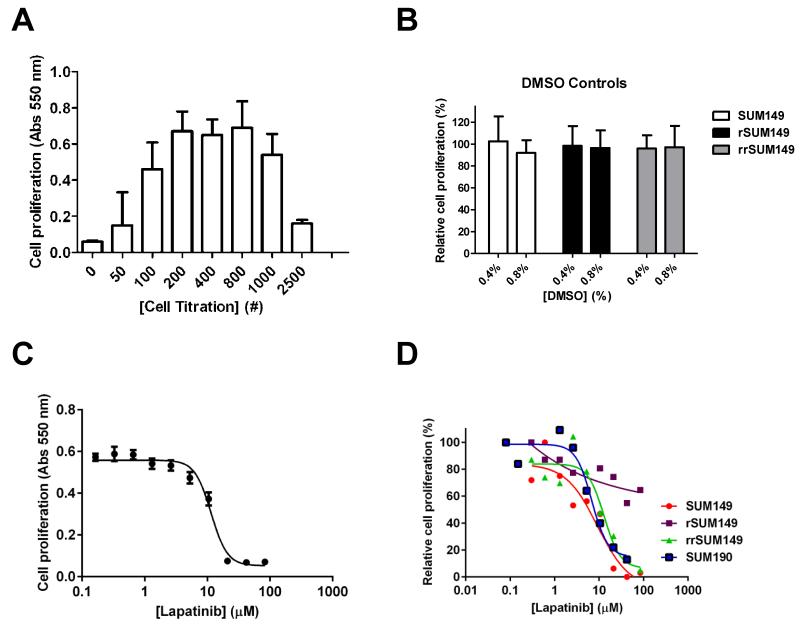
Fig. 1.
Optimization and validation of 384-well format proliferation assay. SUM149 cells were seeded in 384 well plates and the MTT assay was carried out after 72 h as described in Material and Methods. (A) Cell number titration. SUM149 cells were seeded at the indicated cell numbers. Data from triplicate samples. (B) DMSO tolerance. Cells were seeded (800 cells/well) with the indicated concentration of DMSO included in the media and MTT assay carried out for 72 h. For these experiments, in plate controls for minimum signal (Avgmin) in columns 1-2 were no cells and no DMSO and for maximum signal (Avgmax) in columns 23-24 were +cells and no DMSO. The relative proliferation (%) was calculated using the same relationship as in Materials and Methods. Mean and SD based on a minimum of three independent experiments. (C) Sixteen replicate 10-point dose response curves for lapatinib. SUM149 cells (800 cells/well) were incubated with the indicated concentrations of lapatinib for 72 h. (D) Representative qHTS dose response curves for lapatinib on parental SUM149, isogenic rSUM149, rrSUM149 and SUM190 cells. Data was analyzed in GraphPad Prism 5.0.

