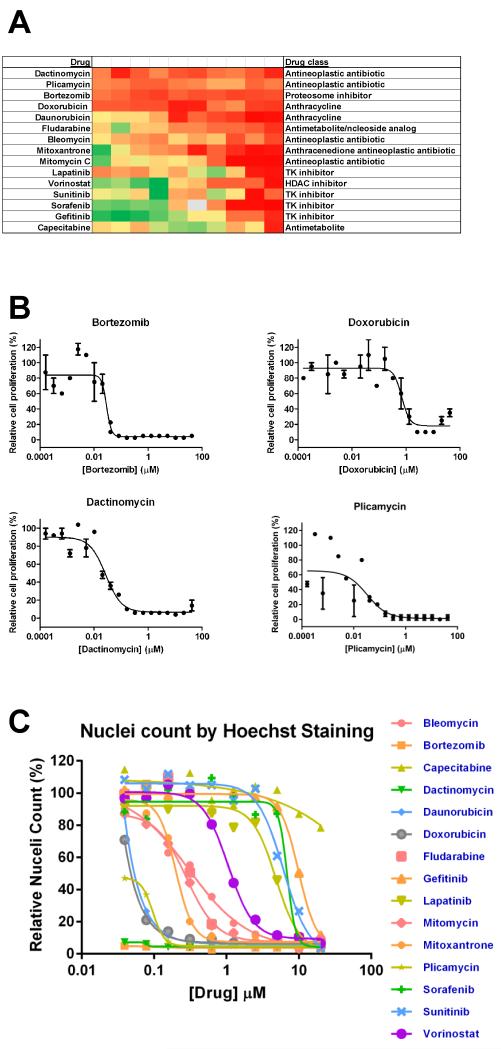
Fig. 2.
Identification of top oncology drugs affecting proliferation of SUM149 cells. (A) Heat map profile for proliferation inhibitory effects of the top 15 drugs from the NCI approved oncology set on parental SUM149 cells. SUM149 cells were incubated with drugs in dose response as a 10-point two-fold dilution series for 72 h and cell proliferation assessed by MTT assay as described in Materials and Methods. For each concentration, percent inhibition values were calculated and data normalized to vehicle and no cell control wells. The heat map key indicates red for 100% inhibition through to green for 0% inhibition. Data from a representative qHTS experiment is shown. (B) 20-point dose response curves for four most potent drugs. Data from duplicate samples. (C) High content Hoechst staining assay for nuclei count. Nuclei count data was normalized and dose response curves for top 15 drugs on SUM149 cells generated by non-linear regression using GraphPad Prism 5.

