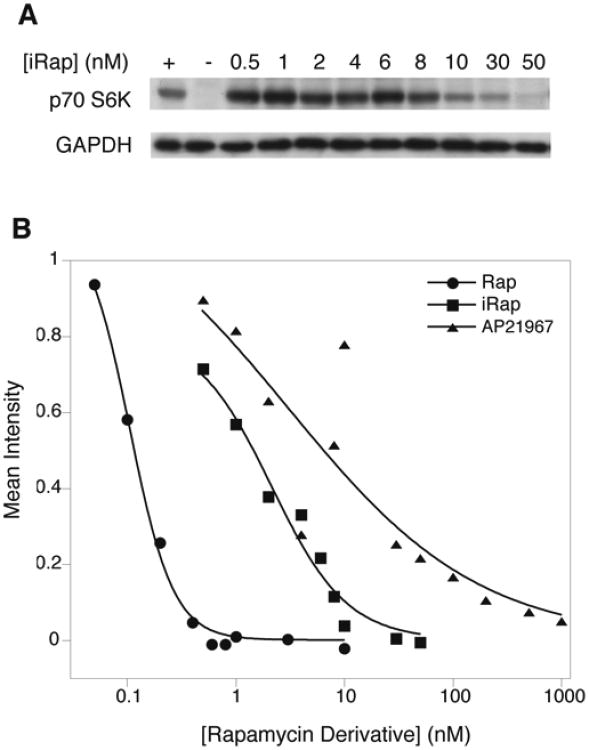
Fig. 5.
Inhibition of mTOR Kinase Activity.
HEK293 cells serum-starved 24 h were mock-treated or treated with rapamycin (0.05-50 nM), iRap (0.5-500 nM), or AP21967 (0.5-500 nM) for 15 min. Serum was added for 30 min and cell lysates were immunoblotted with a phosphospecific antibody against p70 S6K T389. GAPDH serves as a loading control.
A, Representative blot showing levels of phosphorylated T389 of p70 S6K in response to iRap treatment. The plus sign indicates the positive control lane (mock-treated cells) lane and the minus sign indicates the negative control lane (cells treated with 10 nM rapamycin).
B, Intensities of the signal from each sample were quantified with respect to the loading control and normalized to phosphorylation levels in untreated cells. Data were then plotted and fit to derive IC50 values.

