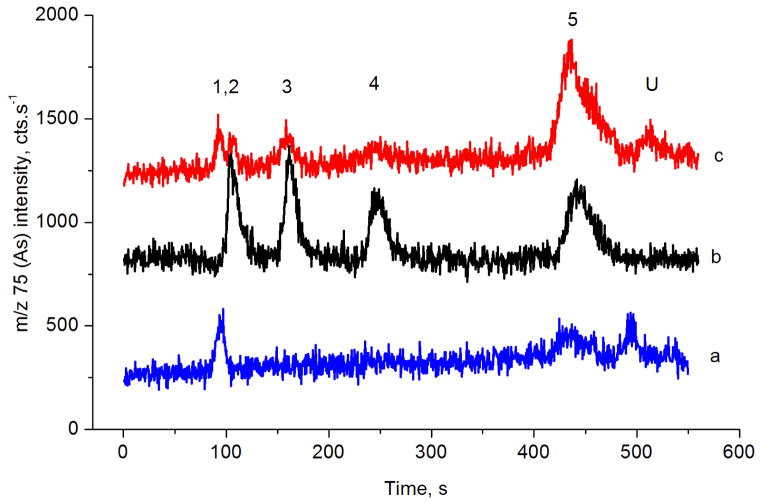
Fig. 4.
HPLC-ICP-MS chromatograms
a: 0.025 M HNO3, pH adjusted with NaOH to approx. 6;
b: Standard 400 ng mL−1 iAs V and 200 ng mL−1 each MAsV, DMAsV and TMAsVO;
c: SLRS-4 river water SRM, pH adjusted with NaOH to approx. 6; 1,2- TMAsVO (void volume) and iAsIII coeluting, 3-DMAV, 4- MAV, 5- iAsV, U- unknown Traces shifted vertically for clarity.

