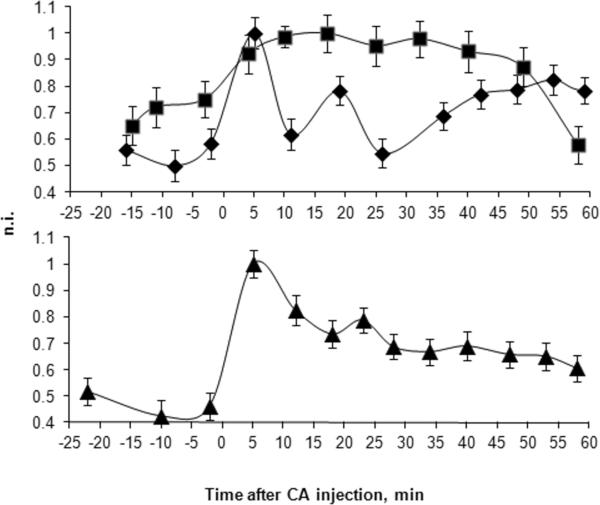
Fig, 5.
Image normalized intensity (n.i.) plot of the duodenal pancreas region. Top graph ■ corresponds to GdDOTA-diBPYREN after i.p. injection of glucose and ◆ corresponds to GdDOTA-diBPYREN after i.p. injection of saline. Bottom graph ▼ corresponds to Prohance™ after i.p. injection of glucose. Image intensity was normalized relative to the highest intensity point for each curve. Agent i.v. injection correspondes to time = 0.

