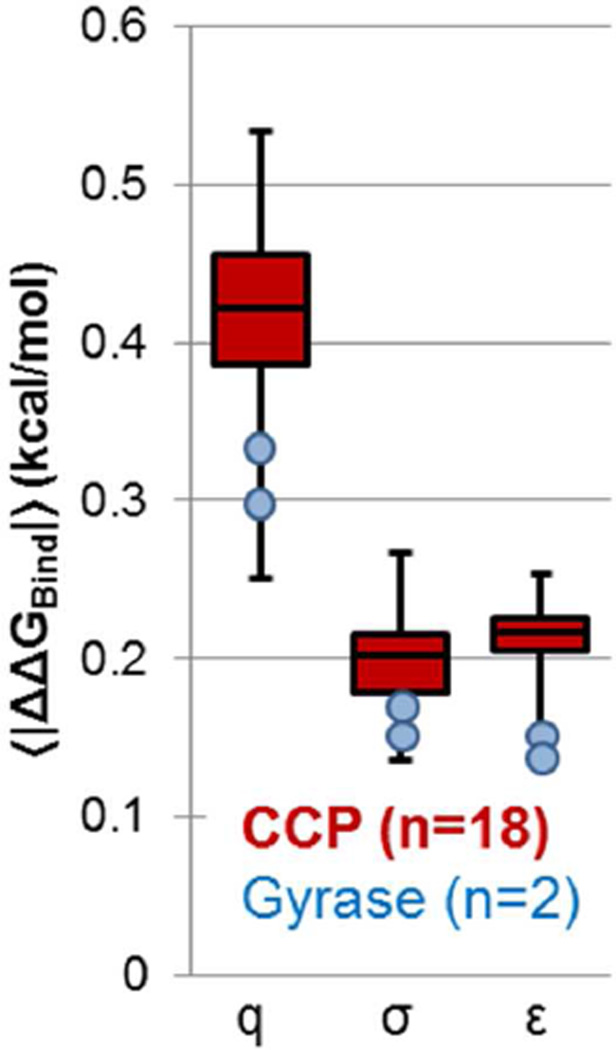
Figure 5. Different ligands show similar sensitivity to charge and van der Waals parameters.
We calculated individual values of 〈|ΔΔGBind|〉for each ligand, and show here the minimum, first quartile, median, third quartile, and maximum 〈|ΔΔGBind|〉 values for the 18 CCP compounds in box plot form (red). Charge (q), radius (σ) and well depth (ε) perturbations are shown separately. 〈|ΔΔGBind|〉 values for the two Gyrase compounds are shown as blue circles.

