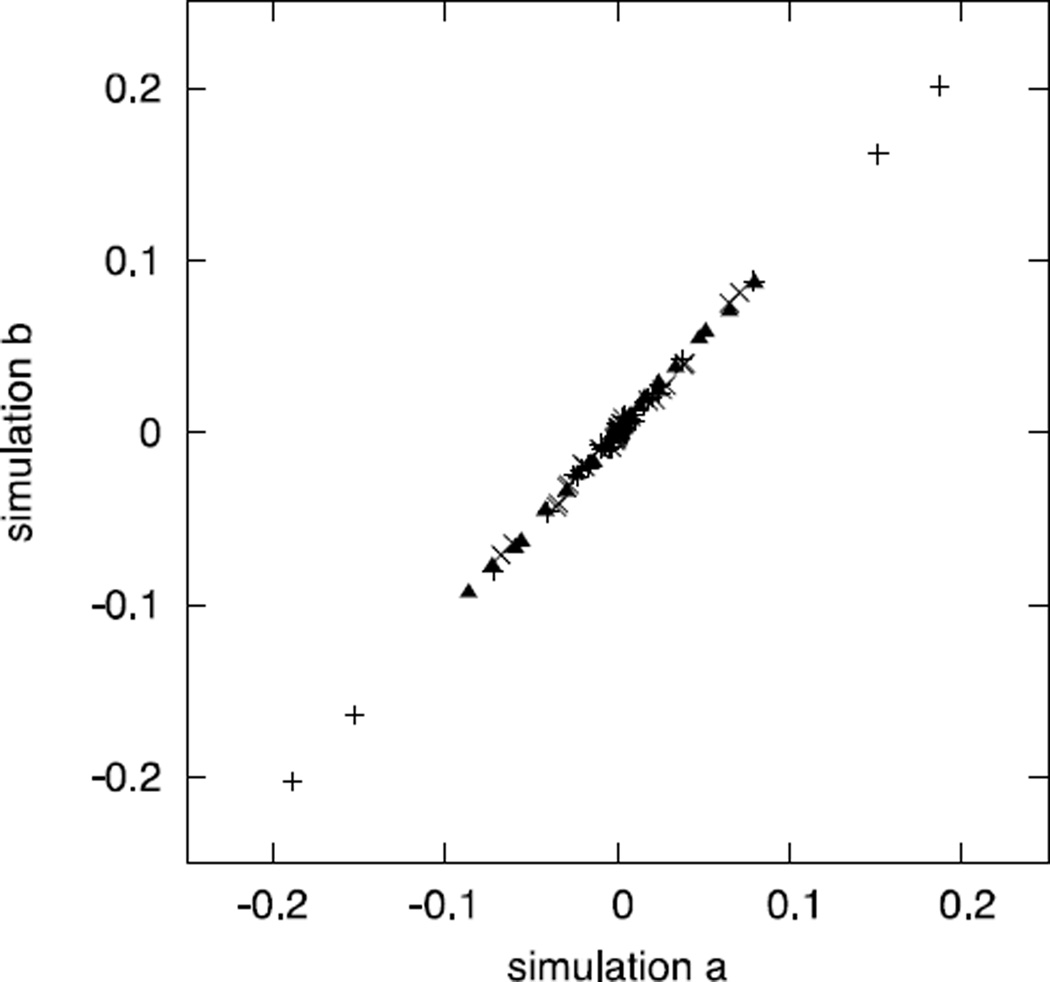
Figure 10.
The gradient of the target function computed by ensemble averages of two simulations (different seeds). We plot the correlation between the two gradients in which every element of the gradient vector is projected onto the axes to obtain the gradient value at each simulation. The high quality linear correlation suggests convergence.

