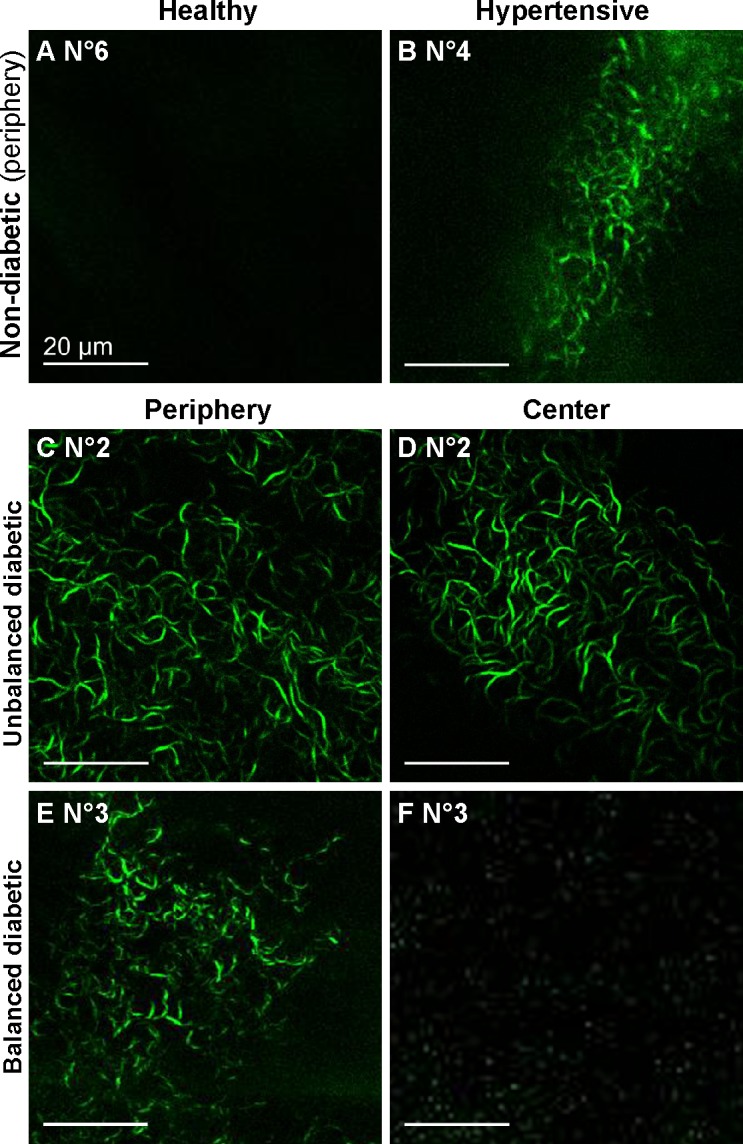
Figure 7. .

Ex vivo SHG images in the DM of human corneas. (A–B) False color images of the corneas from nondiabetic donors, showing sparse SHG signals in corneal periphery of one hypertensive patient (B, in green; 20x objective). (C–F) False color images of the corneas from two diabetic donors, demonstrating the presence of SHG signals (in green) in the entire DM in the case of unbalanced diabetes (C–D; 60x objective) and only in the DM periphery in the case of balanced diabetes (E–F; 20x objective). Scale bar, 20 μm.
