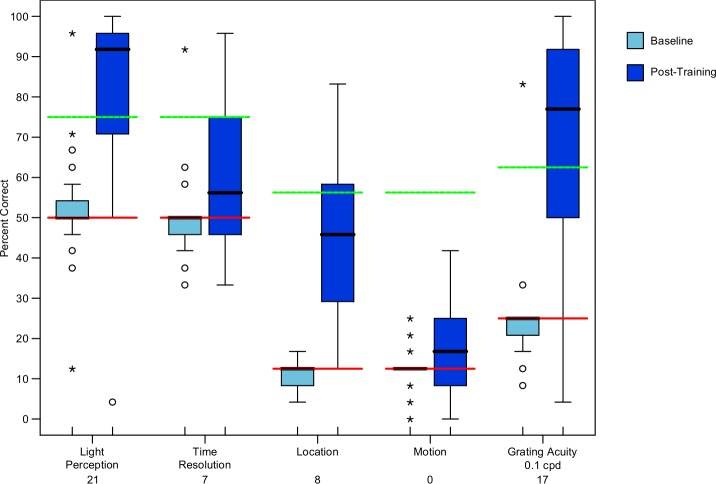
Figure 4.
A box plot that demonstrates the percent correct among our subjects for the BaLM and BaGA tests. Red lines show chance level, green lines show success threshold, and black lines show median scores. The number below the test on the x axis represents the number of subjects that achieved our success threshold for the given test. Light blue boxes indicate baseline and dark blue boxes indicate post training.

