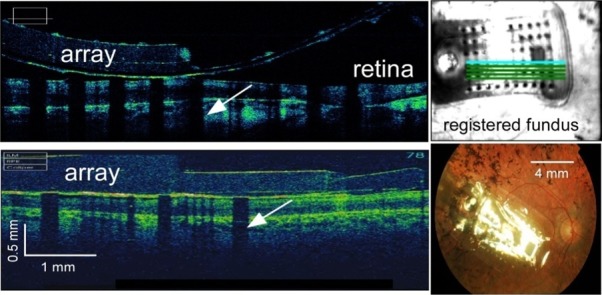
Figure 2. .

Spectral-domain optical coherence tomography (SD-OCT) with registered fundus images allow for electrode–retina distance to be measured. SD-OCT b-scans taken across portions of 12-001′s electrode array (top left) using a Cirrus SD-OCT and 52-001′s array (bottom left) using a Topcon SD-OCT. The metal electrodes block light from the scanning light source, casting shadows (white arrows) on the retinal image. Electrode shadows along with corresponding registered fundus images (top right) allow for the measurement of electrode–retina distance. (Bottom right) Fundus image of subject 61-003.
