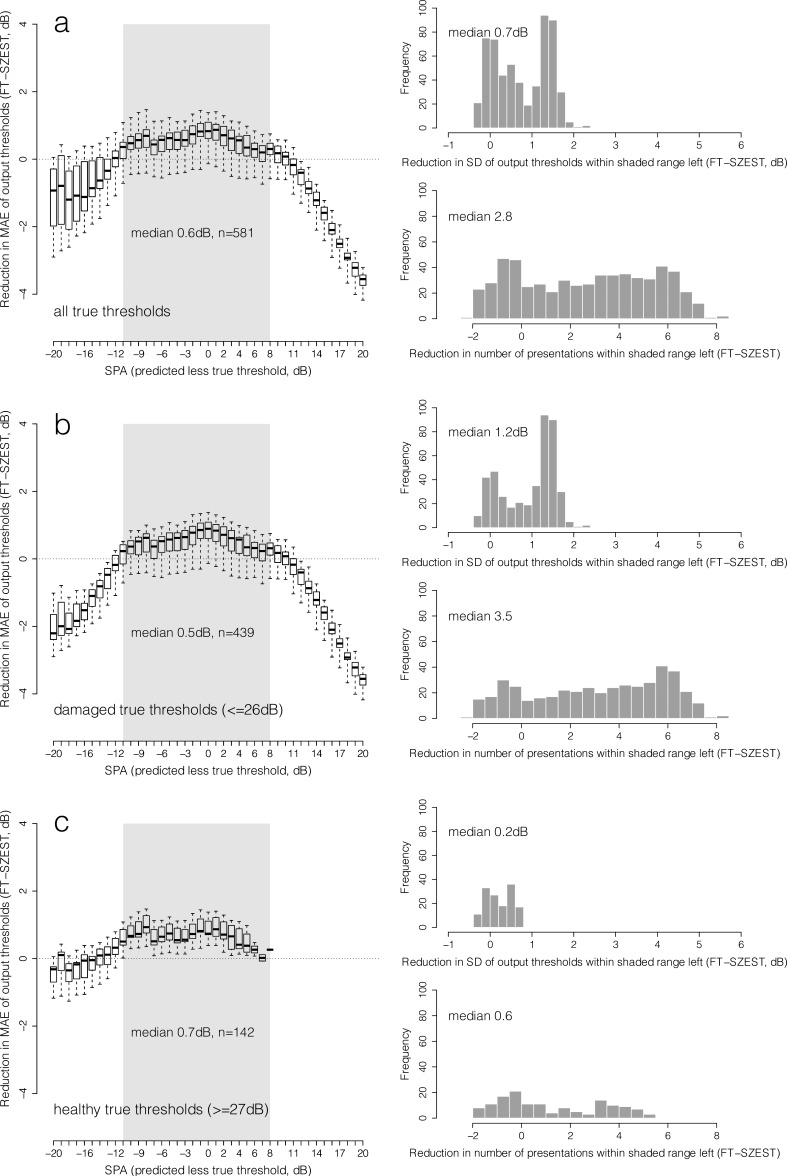
Figure 2. .
Box and whisker plots show median, interquartile range, and 90% range (whiskers: fifth to 95th percentile) of distribution of reduction in MAE (SZEST-FT matched by true threshold, dB) using SZEST across all combinations of structure-predicted and true threshold for each SPA (predicted less true threshold) given on the x-axis (from −20 to +20 dB) (reliable observers). Data are shown for all true thresholds simulated (row a), damaged true thresholds only (≤26 dB, row b) and healthy true thresholds only (≥27 dB, row c). Shaded area on boxplots represents the range of SPA where 25th percentile of MAE reduction was greater than 0 dB across all possible true thresholds. Histograms in each row show the distribution of reductions (SZEST-FT, dB) in SD of output threshold and presentation count for prediction accuracies within the shaded area.

