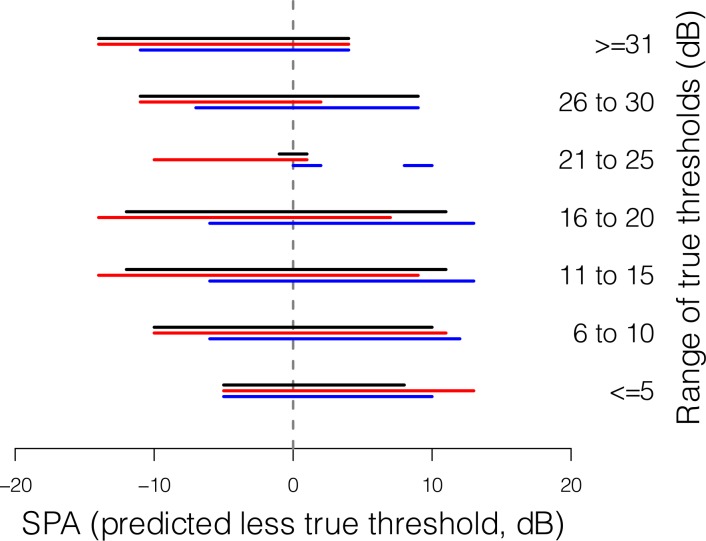
Figure 5. .
Bars show the range of SPA (predicted less true threshold) across which SZEST outperforms FT in 75% of instances for all possible true thresholds within the range given to the right of each bar. Data are shown for reliable observers (black bars), FP observers (red bars) and FN observers (blue bars).

