Figure 3.

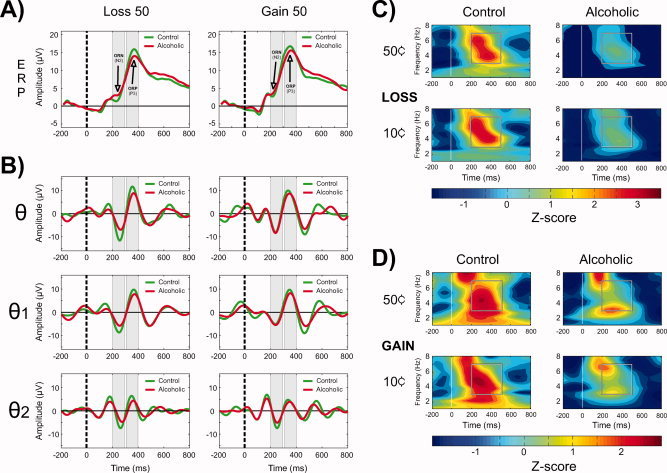
The grand‐averaged ERP waveforms are shown in Panel A. In Panel B, theta bands (rows 2, 3, and 4) during Loss 50 and Gain 50 conditions at FZ electrode are shown. The region of ORN and ORP peaks and the corresponding theta activity during the time window are shaded in gray color. There is a partial phase‐alignment of the theta activity corresponding to ORN (200–300 ms) and ORP (300–400 ms) components. Alcoholics showed decreased amplitude in both broadband (3–7 Hz) and subbands (3–5 and 5–7 Hz) of theta activity, and this difference was more pronounced during the loss condition. Time (in millisecond) is shown on the X‐axis, and the amplitude (in microvolt) is represented on the Y‐axis. The dashed vertical line (at 0 ms) represents the onset of an outcome stimulus. Panels C and D represent the time‐frequency (TF) plots during the loss condition at Fz electrode and the gain condition at Pz electrode in the alcoholic and control groups. The white line at 0 ms represents the onset of the outcome stimulus. The square box inside each plot marks the time‐frequency region of interest, namely the time interval of 200–500 ms across the theta frequency range 3–7 Hz for the analysis. The alcoholic group showed a significant reduction in theta power during each outcome condition. The color scale represents the theta power in terms of Z‐scores, which were computed from the overall data (representing all groups and conditions) and hence are comparable among the TF plots.
