Figure 5.

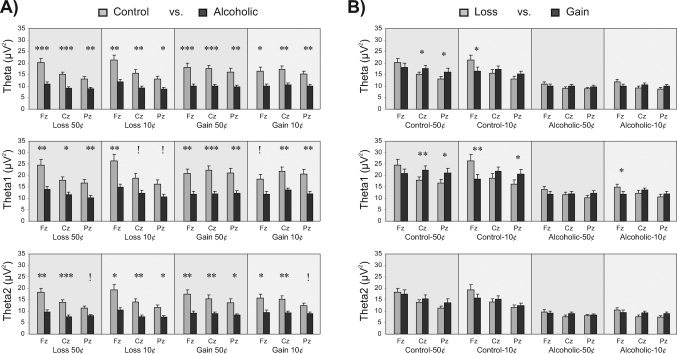
In Panel A, the bar graphs show the pair‐wise comparisons of mean theta power (in μV2) across groups (control vs. alcoholic group) during each outcome condition at three electrode sites (Fz, Cz, and Pz). Alcoholics show significantly decreased theta power during all outcomes. The asterisks (*) indicate the level of significance (*P < 0.05, **P < 0.01, and ***P < 0.001) after the Bonferroni correction for multiple comparisons, and the exclamation mark (!) indicates the loss of significance after the Bonferroni correction. In Panel B, the bar graphs show the pair‐wise comparisons of mean theta power (in μV2) across valence (loss vs. gain) during 50¢ and 10¢ conditions in control and alcoholic groups at three electrode sites (Fz, Cz, and Pz). In both control and alcoholic group, Loss was larger than Gain at Fz electrode, and Gain was larger than Loss at Cz and Pz electrodes. The comparisons (between loss and gain) were significant only in the control group for theta broadband and for low theta before Bonferroni adjustment. In the alcoholic group, although a similar pattern (anterior loss and posterior gain) is observed, the differences are not significant. None of the comparisons was significant after Bonferroni correction.
