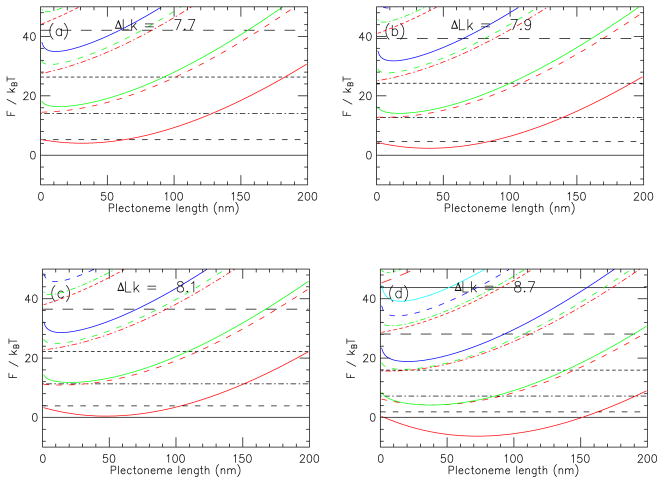
FIG. 2.
(Color online) Free energies of states with different (n, m) and Lp near buckling transition for 2.2 kb molecule in 150 mM Na+ buffer subject to 2 pN force. Free energies are measured relative to that of the n = 0, m = 0 state. Horizontal black lines indicate straight DNA with different numbers of chiral curls and no plectonemic domains (m = 0): solid, n = 0; dashed, n = 1; dot-dashed, n = 2; short dashed, n = 3; long dashed, n = 4. Curves indicate free energy as function of length of interwound plectonemic region for states with successively larger numbers of plectonemic regions: the line dash style indicates the number of curls in that state, following the same labeling as the straight-curl states. Plectonemic states with m = 1, 2, 3 and 4 for each value of n (each dash type) have free energies which increase with m for each value of plectoneme length (m = 1, 2, 3 and 4 are shown in red, green, blue and cyan, respectively). Parts (a), (b), (c) and (d) show the free energies for successively larger linking numbers passing through the buckling transition. The uppermost solid line in (d) shows the (5, 0) state.

