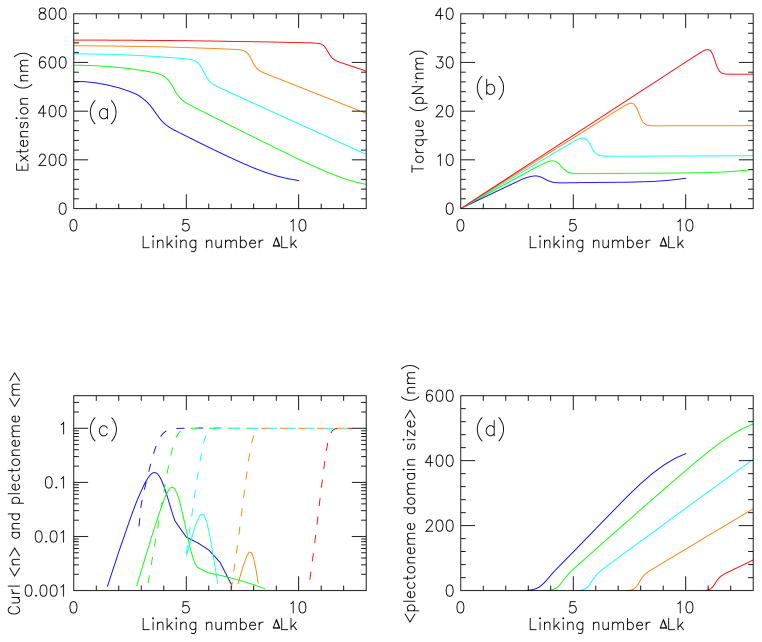
FIG. 3.
(Color online) Properties of stretched twisted DNA as a function of linking number, for a 2.2 kb molecule in 150 mM Na+ buffer, for forces of 0.25 (blue), 0.5 (green), 1 (cyan) 2 (orange) and 4 pN (red).
(a) Extension versus linking number (curves show results for successively higher forces from bottom to top).
(b) Torque versus linking number (curves show results for successively higher forces from bottom to top).
(c) Average number of plectonemic (〈m〉, dashed) and curl ( 〈n〉, solid) regions (solid curves show 〈n〉 values for successively higher forces from left to right for 0.25 to 2 pN, with the 4 pN results too small to appear on this plot; dashed curves show 〈m〉 values for successively higher forces from left to right).
(d) Mean plectoneme domain size (〈Lp/m〉) for states containing interwound plectonemic regions (curves show results for successively higher forces from left to right).

