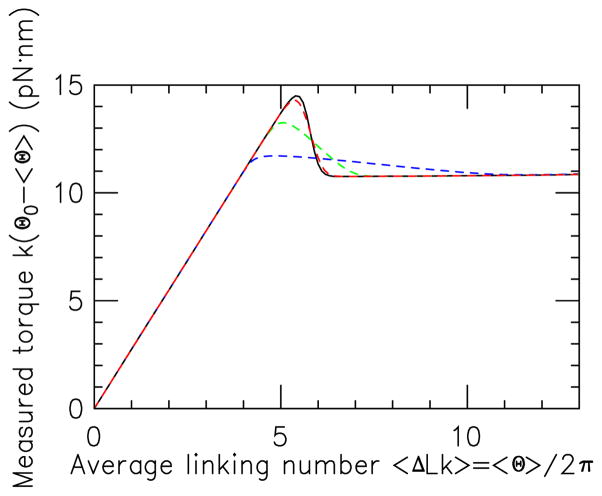
FIG. 9.
(Color online) Measured torque for 2.2 kb DNA in 150 mM salt buffer under 1 pN force, for spring constants k = 1, 0.1 and 0.01 kBT/rad2 (dashed uppermost red, middle green and bottom blue curves, respectively). Torque overshoot is smoothed out as k is decreased, but small values of k are needed to completely eliminate it. The k = 1 curve is indistinguishable from the “true” torque (solid black, same as 1 pN curve in Fig. 3(b)).

