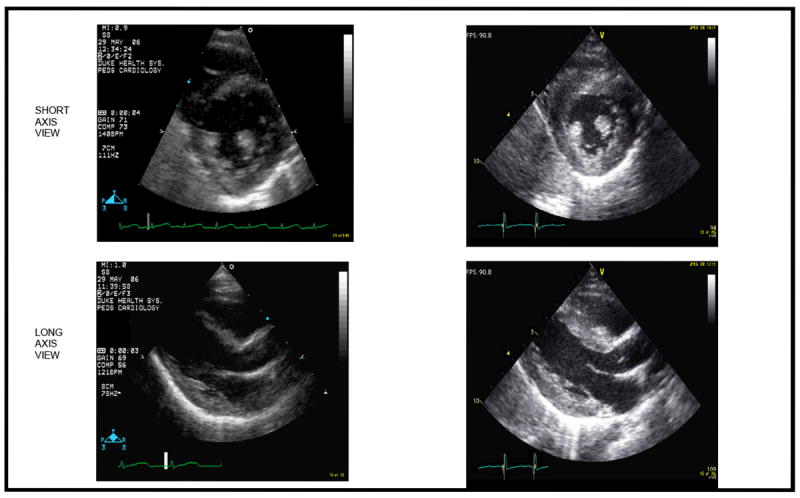
Figure 1. Left Ventricular Hypertrophy on Echocardiography.

Two dimensional echocardiogram images from one patient with GSD IIIa who experienced marked increase in measures of wall thickness as well as increased LV mass. The left upper panel is the short axis view of the left ventricle at baseline; the left lower panel is the long axis view of the left ventricle at the same time. On the right, in the upper panel is the short axis view of the left ventricle one year later; the left lower panel is the long axis view of the left ventricle one year later.
