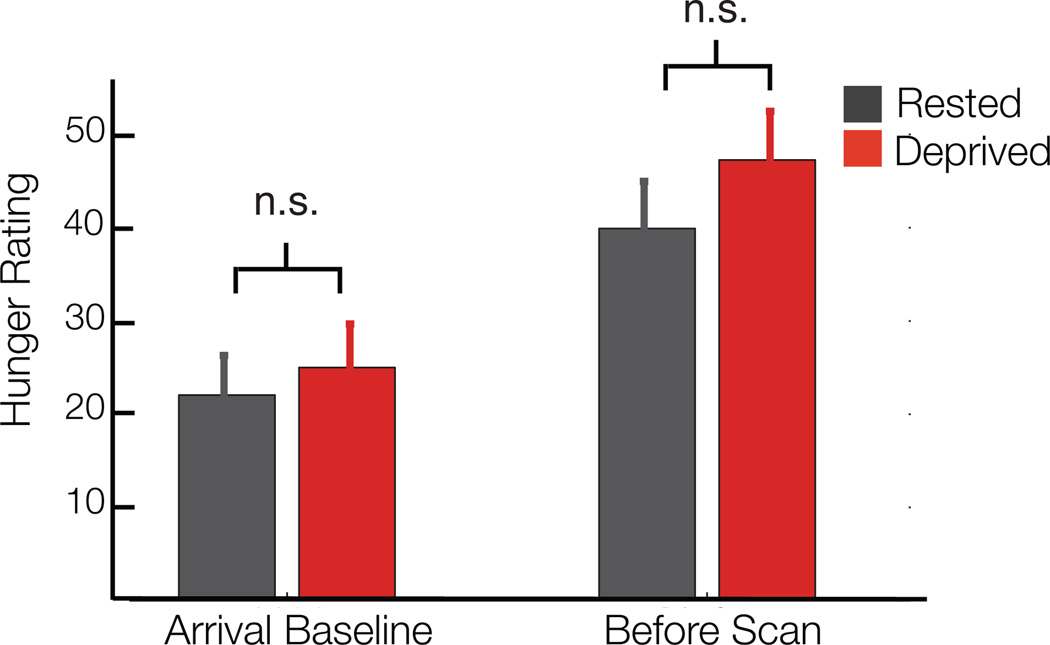
Fig. 2. Self reported hunger levels.
Collected using a visual analog scale with a 10cm line, y-axis is in millimeters. There were no significant differences between sleep rested and sleep deprived sessions either at arrival or before the scan session. However, hunger levels were significantly greater before the scan compared to arrival in both groups (p < .05; paired t-tests across 23 participants). Error bars are s.d.

