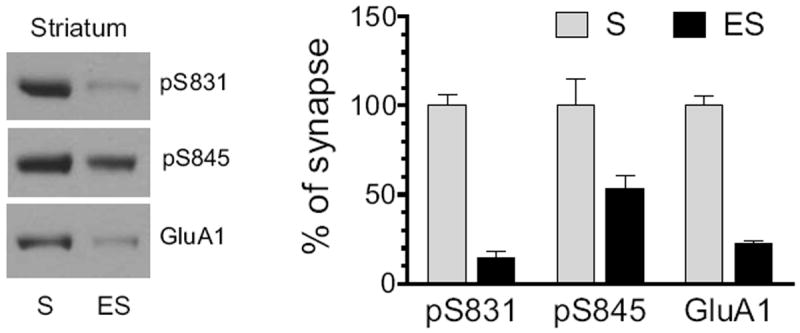
Figure 1. Normal subsynaptic distribution of pGluA1 and GluA1 in the rat striatum.

Distribution of pGluA1-S831, pGluA1-S845, and GluA1 was detected in synaptic and extrasynaptic membranes. Representative immunoblots are shown left to the quantified data. Proteins enriched from synaptic (S) and extrasynaptic (ES) membranes were loaded at the same amount (12 μg per lane). Data are presented as means ± S.E.M. (n = 3 per group).
