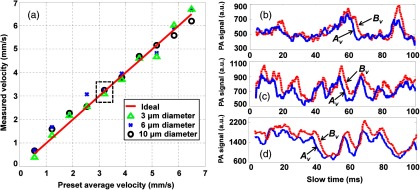
Fig. 4.

(a) Flow velocities measured using three sizes of microspheres. (b)–(d) The slow-time PA profiles from (blue solid line) and (red dashed line) in Fig. 1 with the same flow speed [dashed box in (a)] for (b) 3 μm, (c) 6 μm, and (d) 10-μm-diameter microspheres. The calculated average time shift between the blue and red slow-time PA profiles is the same regardless of individual profile shapes.
