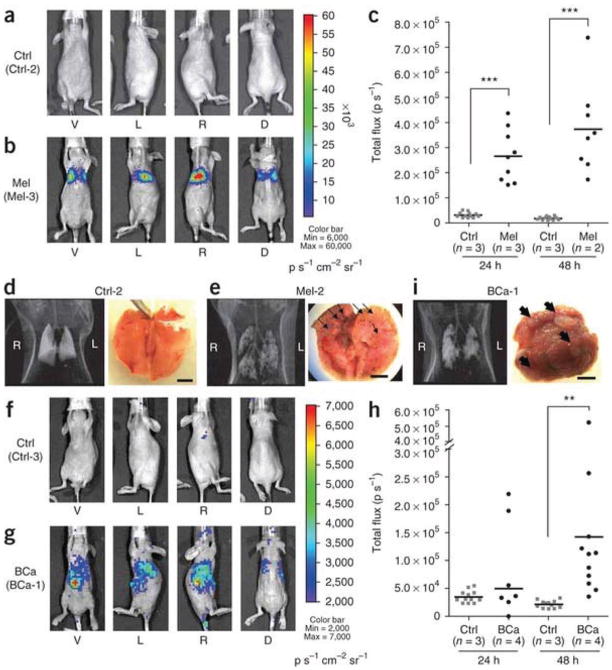
Fig. 4.
Cancer-specific PEG-3-promoter activity shown by bioluminescence imaging in experimental metastasis models of human melanoma (Mel) and breast cancer (BCa). (a) Bioluminescence imaging of a representative healthy control mouse (Ctrl-2). (b) Bioluminescence imaging showing firefly luciferase expression observed in a representative melanoma model (Mel-3). Each mouse was imaged from four directions (V, ventral; L, left side; R, right side; D, dorsal views) to cover the entire body. Pseudocolor images from the two groups were adjusted to the same threshold. (c) Quantification of bioluminescence imaging signal intensity in the control group (Ctrl) and melanoma group at 24 and 48 h after injection of pPEG-Luc–PEI polyplex. Quantified values are shown in total flux. ***P < 0.0001. (d,e) CT scans and gross anatomical views of lung from one representative mouse from the control group (d) and the melanoma group (e). (f,g) Bioluminescence imaging of one representative mouse from the control group (f, Ctrl-3) and the experimental breast cancer metastasis group (g, BCa-1). The pseudocolor images were adjusted to the same threshold. (h) Quantification of bioluminescent signal intensity in the Ctrl and breast cancer groups at 24 and 48 h after injection of pPEG-Luc–PEI polyplex. **P = 0.0066. (i) A CT image and a macroscopic view of lung from a representative breast cancer mouse. Displayed bioluminescent images (a,b,f,g) were obtained at 48 h after the systemic delivery of pPEG-Luc–PEI polyplex. Black arrows (e,i) indicate metastatic nodules observed in the lung. Scale bars, 5 mm. From Bhang et al. (37), Nature Medicine, 2011.

