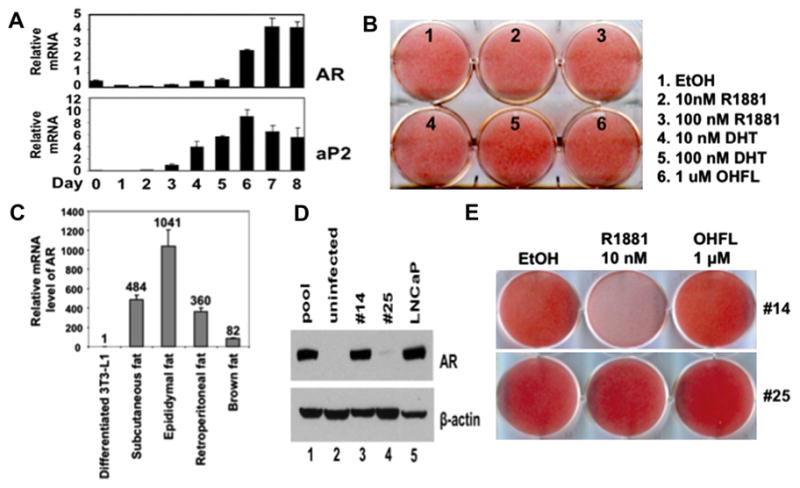
Fig. 1.

AR expression and action in mouse adipocytes. (A) Induced AR and aP2 mRNA levels in wild-type 3T3-L1 cells during adipogenic differentiation. (B) Wild type 3T3-L1 cells were treated with adipocyte differentiation cocktail in the presence of androgens for 8 d followed by Oil Red O staining. (C) Relative AR mRNA for in vitro differentiated 3T3-L1 cells and murine adipose tissues. (D) 3T3-L1-AR stable cell lines were created by infecting 3T3-L1 cells with lentivirus expressing flag-tagged AR. Western blot comparison of AR protein levels in pooled 3T3-L1 infected with fAR lentivirus and uninfected 3T3-L1 with 3T3-L1-fAR stable clones #14 and #25. LNCaP, a prostate cancer cell line with endogenous AR expression, was used for comparison of relative AR expression levels. (E) 3T3-L1 fAR stable clones #14 and #25 were differentiated in the presence of ethanol (EtOH), 10 nM R1881, or O-hydroxyflutamide (O-HFL) for 8 d. Oil-Red-O was used to determine effects of hormones on adipogenesis in both clones.
