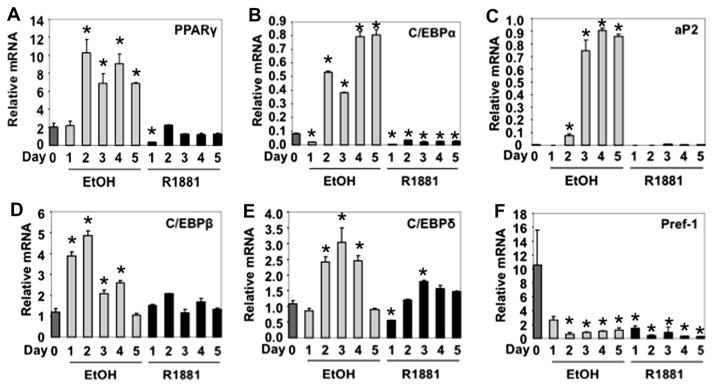
Fig. 2.

Effect of androgen treatment on the expression of key genes in adipogenesis using 3T3-L1-fAR stable cell line (#14). 3T3-L1 fAR cells were differentiated for up to 5 days in the presence or absence of 10 nM R1881. qPCR was used to measure mRNA expression for (A) PPARγ, (B) C/EBPα, (C) aP2, (D) C/EBPβ (E) C/EBPδ, and (F) Pref-1. All results are n = 2 ± S.E.M. Asterisks indicate mRNA statistically different from the vehicle control (*p < 0.05).
