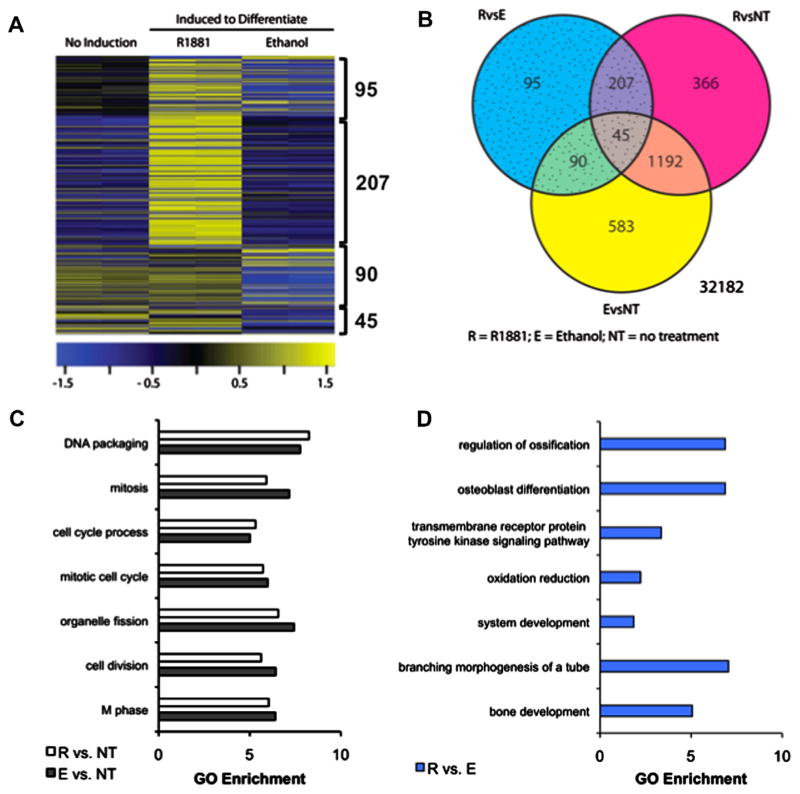
Fig. 3.
Androgen regulation of genome-wide gene expression during adipogenesis in 3T3-L1-fAR cells. Confluent 3T3-L1-fAR cells (clone #14) were induced to differentiate for 24 h in the presence of 10 nM R1881 (R), EtOH (E) or were left undifferentiated (no treatment; NT). (A) Shown are array probes significantly different between cells differentiated in the presence or absence of androgen; FC > 2; q-value < 0.05. Significantly changed probe sets in the R v. E contrast are highlighted. (B) Genes shared and unique to each treatment group represented by Venn diagram. (C) Gene Ontology (GO) analysis of R1881 (R) and ethanol (E) treatments versus NT controls showed no pathways were differentially enriched. (D) Further GO analysis of genes between R and E showed pathways associated with bone differentiation significantly enriched. Genes with FC > 2 and FDR < 0.05 were used for GO analysis.

