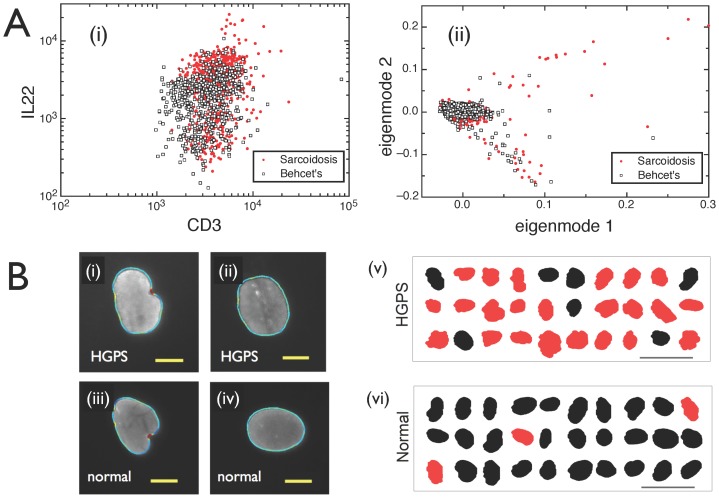
Figure 1. Identifying diseases from heterogeneous single cells.
A. Using standard methods of flow cytometry analysis, diseases such as sarcoidosis and Behçet's cannot be separated. (i) 2D scatter plot using markers CD3 and IL22. (ii) 2D Singular-Value decomposition analysis. Figs. A(i)–(ii) show CD8+ T cell subsamples from a cohort of 7 sarcoidosis patients and 6 patients diagnosed with Behçet's disease, but similar overlaps are also observed for other cell types and marker pairs. B. Cell ensembles carry the signatures of health and disease, despite heterogeneity at the single-cell level. (i)–(iv) Nuclear shapes of healthy and diseased (HGPS) cells can be classified as either blebbed or non-blebbed. Scale bar: 10 µ. Note that it is impossible to tell whether a person has the disease or not based on the analysis of a single cell. (v) Classifying nuclei as blebbed (red) or non-blebbed (black) based on just one shape parameter, which is automatically determined via custom image analysis software. Most cells in the ensemble of 30 randomly selected nuclei from a diseased cell line are labeled as blebbed. Scale bar: 50 µ. (vi) Conversely, analyzing nuclei from a healthy cell line, most cells are labeled as non-blebbed.

